Apple
Can Apple's services engine outrun a slower hardware cycle?
Devices bring customers into the ecosystem. Services changes the revenue mix. Cash generation and repurchases decide how much of that progress reaches each share.
In the systemCheckout & paymentsCannibals portfolioWhere it sits ↓
Model updated on
THE STORY IN PICTURES
The device starts it. The ownership math finishes it.
Follow the installed base through Services, cash conversion, and net share retirement.
 Enlarge graphic
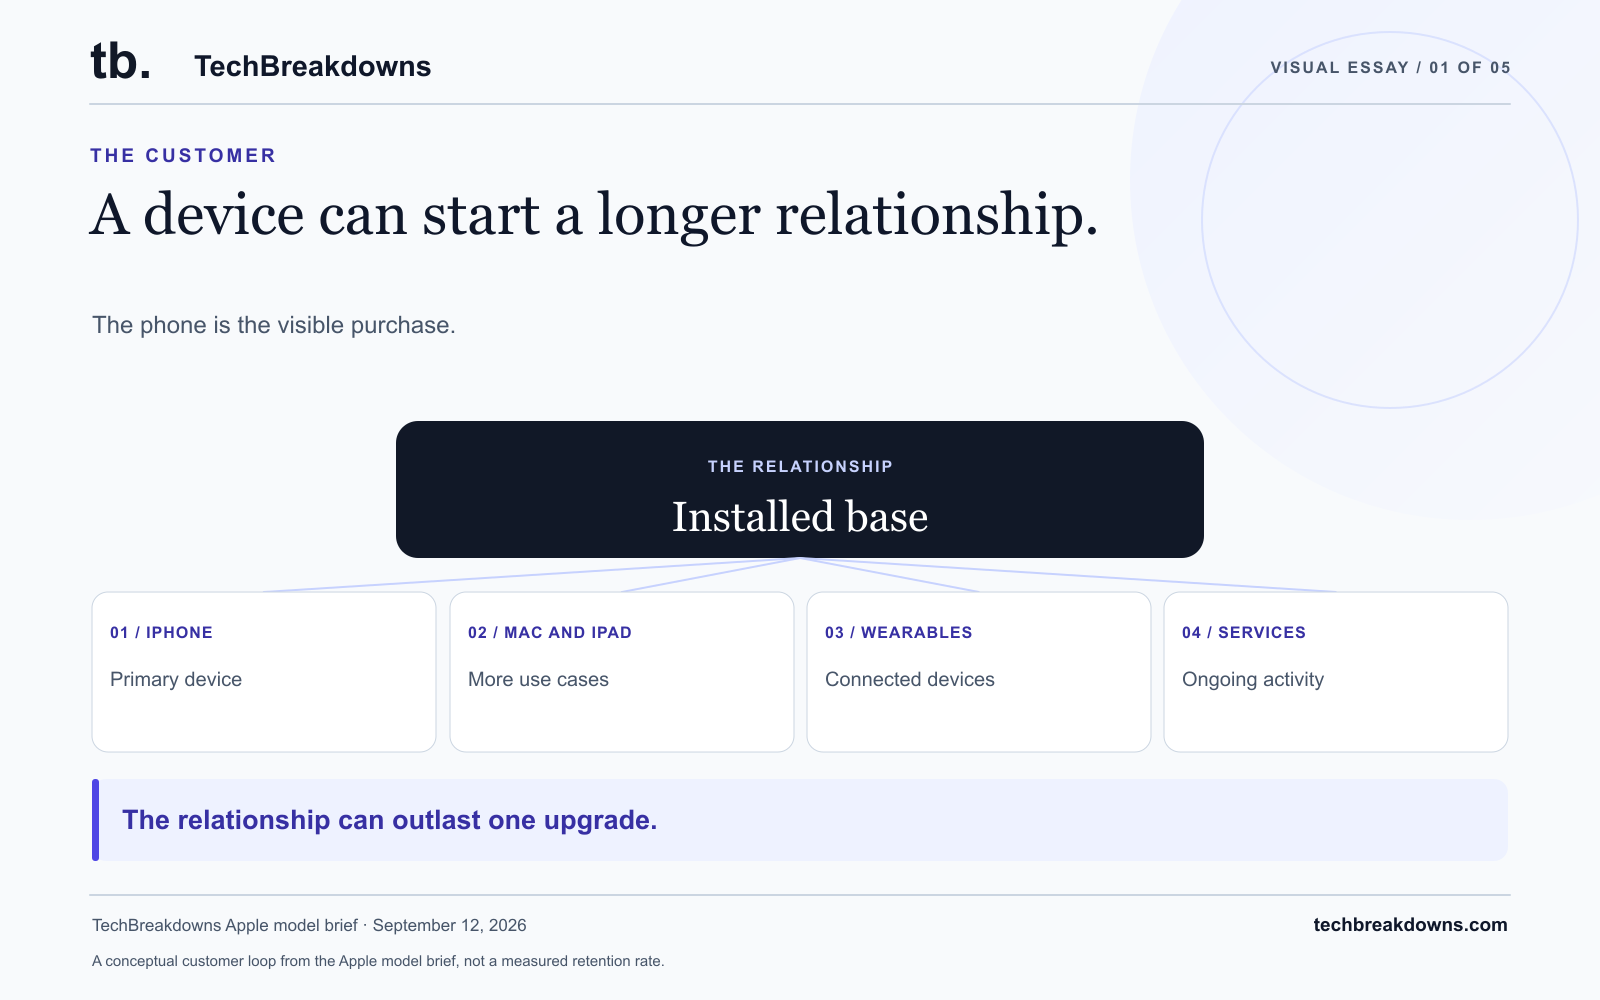
THE CUSTOMER
A device can start a longer relationship.
The phone is the visible purchase. Services and future upgrades depend on a customer continuing to find value in the broader ecosystem.
A conceptual customer loop from the Apple model brief, not a measured retention rate.
TechBreakdowns Apple model brief · September 12, 2026
 Enlarge graphic
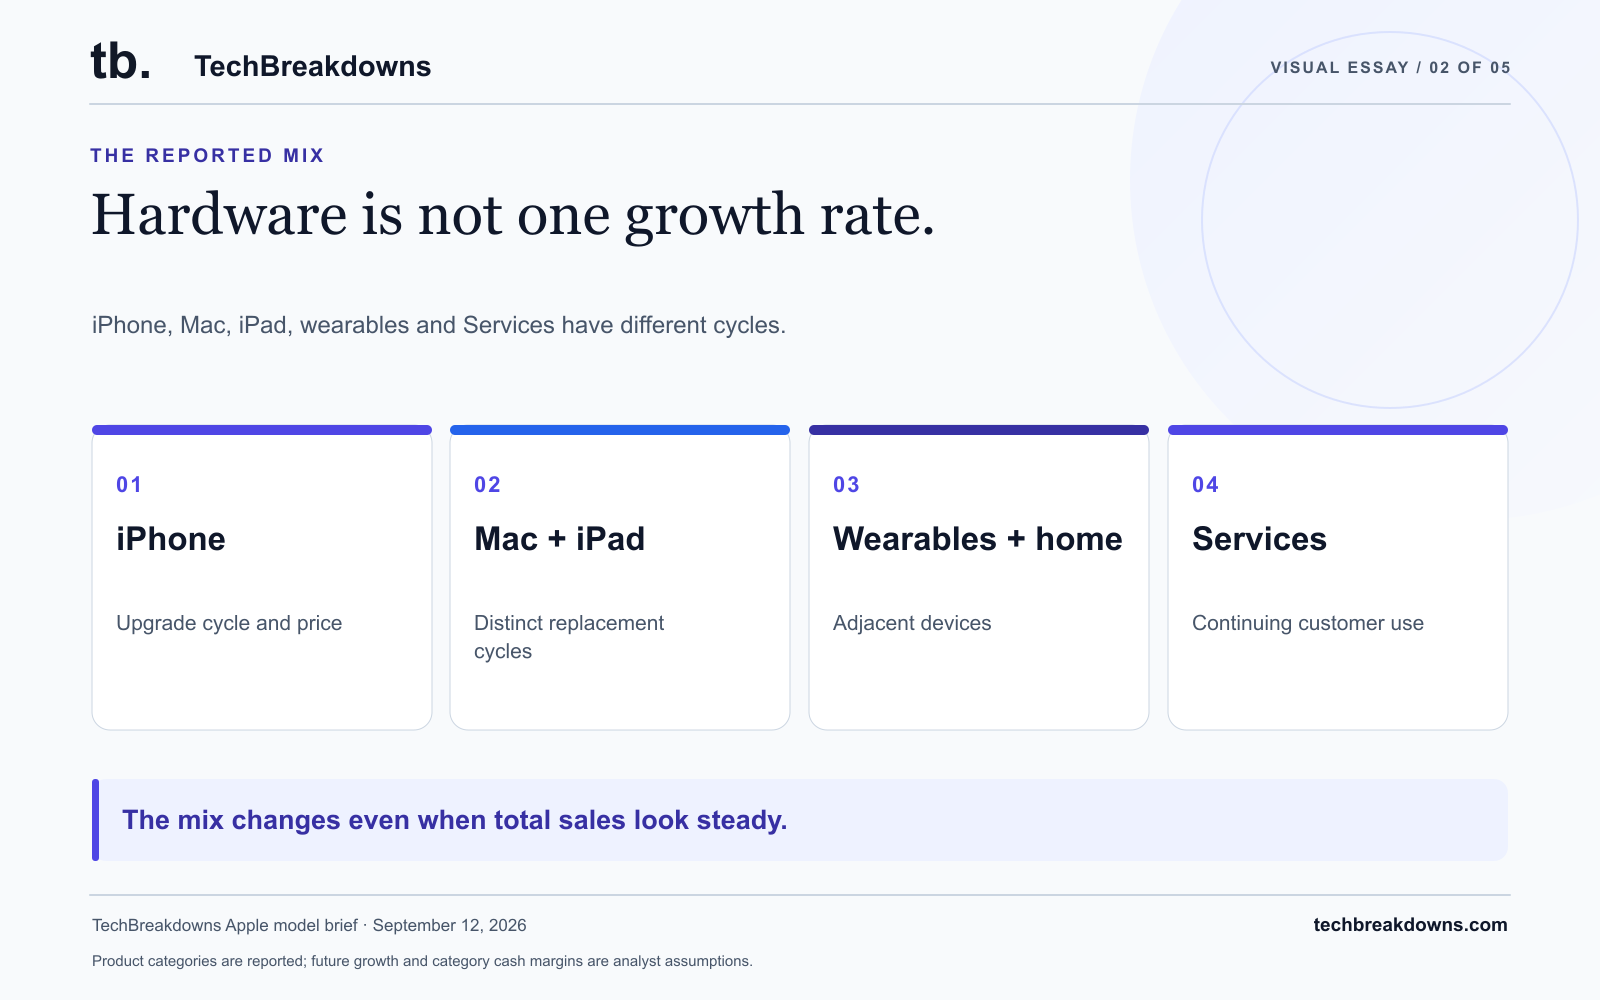
THE REPORTED MIX
Hardware is not one growth rate.
iPhone, Mac, iPad, wearables and Services have different cycles. The model separates the reported categories before bringing their economics together.
Product categories are reported; future growth and category cash margins are analyst assumptions.
TechBreakdowns Apple model brief · September 12, 2026
 Enlarge graphic
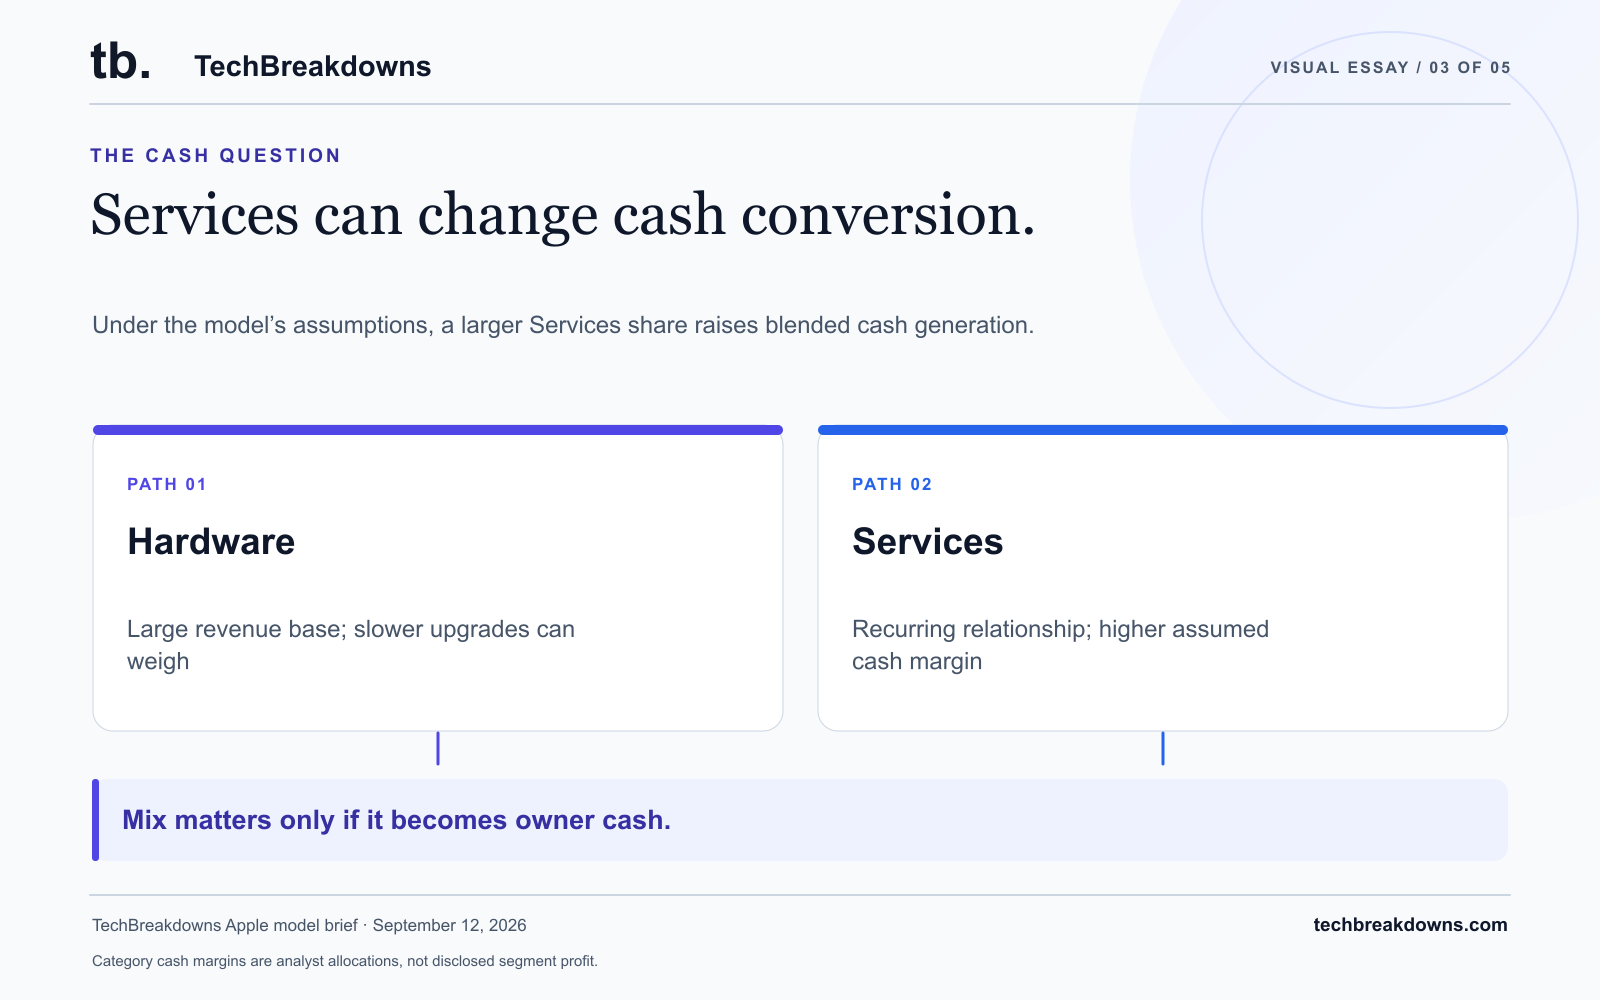
THE CASH QUESTION
Services can change cash conversion.
Under the model’s assumptions, a larger Services share raises blended cash generation. That benefit must overcome slower hardware demand.
Category cash margins are analyst allocations, not disclosed segment profit.
TechBreakdowns Apple model brief · September 12, 2026
 Enlarge graphic
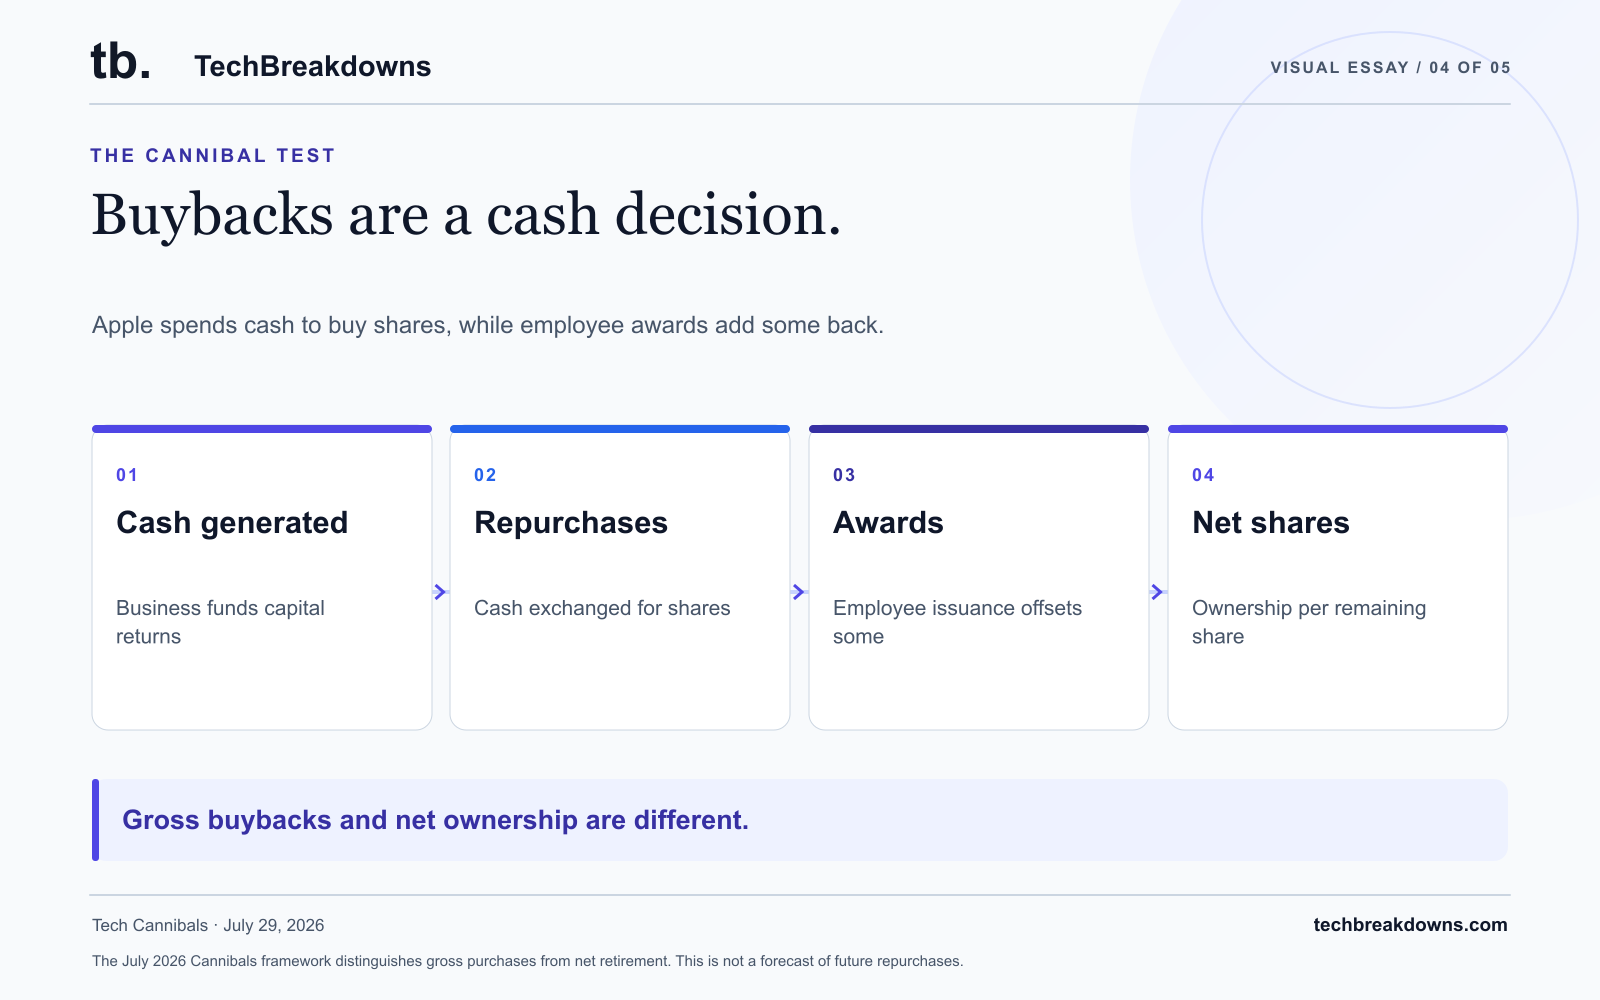
THE CANNIBAL TEST
Buybacks are a cash decision.
Apple spends cash to buy shares, while employee awards add some back. The owner should judge the net share count and the price paid for each repurchase.
The July 2026 Cannibals framework distinguishes gross purchases from net retirement. This is not a forecast of future repurchases.
 Enlarge graphic
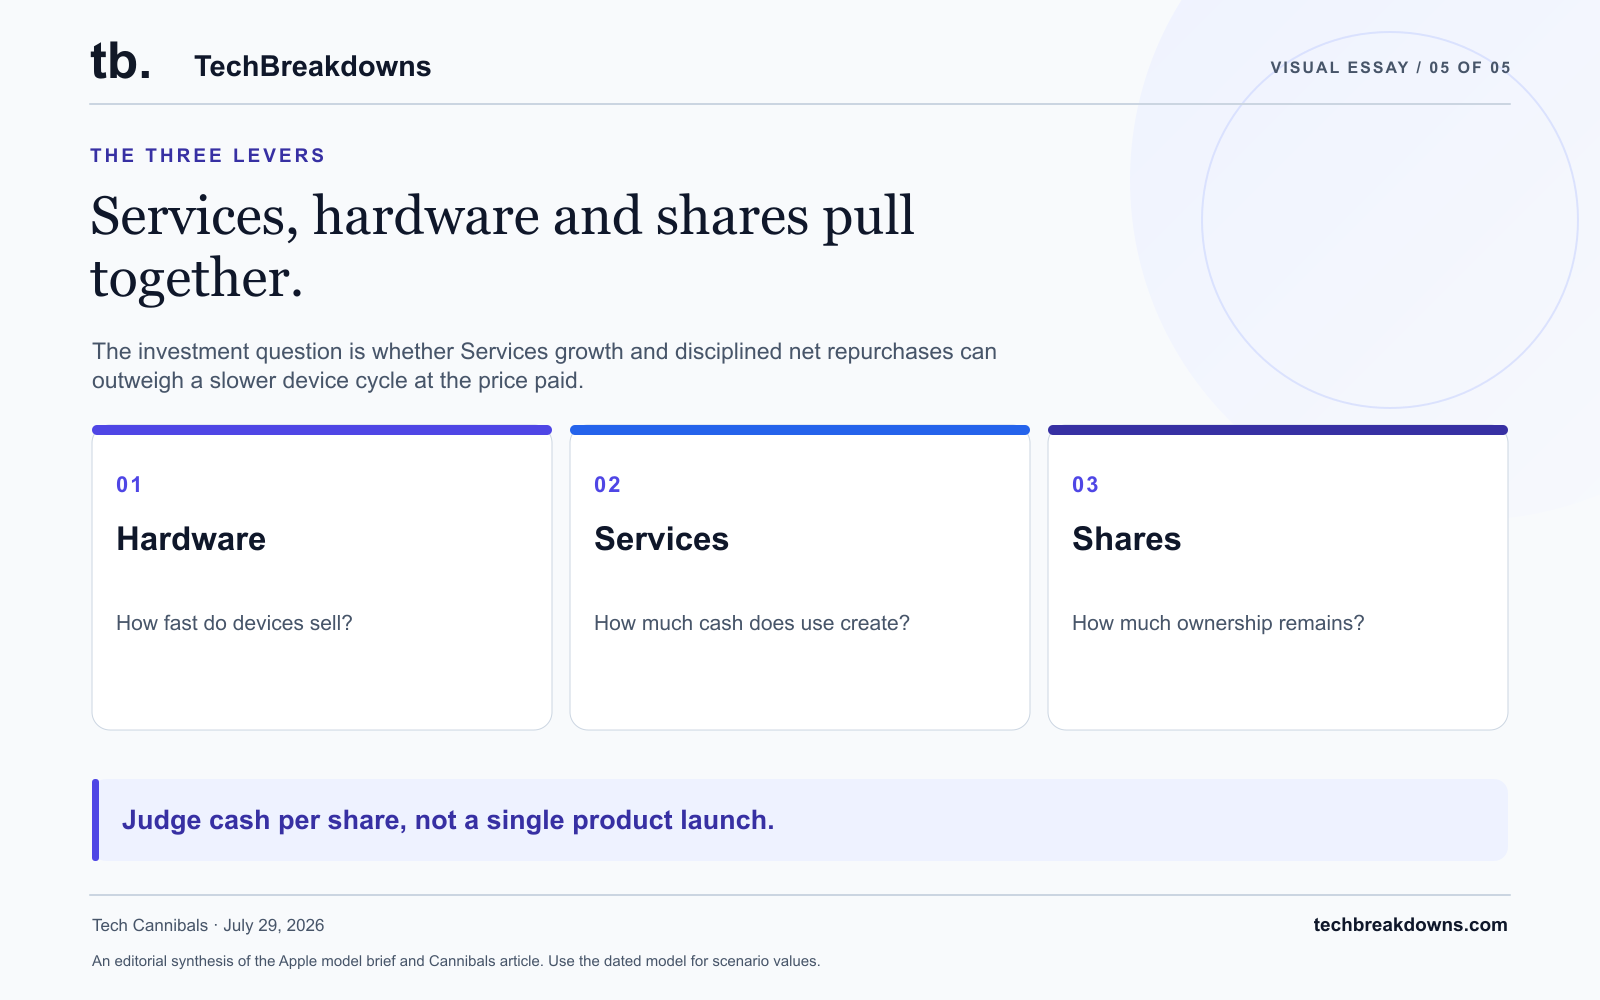
THE THREE LEVERS
Services, hardware and shares pull together.
The investment question is whether Services growth and disciplined net repurchases can outweigh a slower device cycle at the price paid.
An editorial synthesis of the Apple model brief and Cannibals article. Use the dated model for scenario values.
The thesis in a minute
THE OVERVIEW
First, understand
the business.
The idea, the advantage,
and the question that matters.
The phone is the visible purchase. The services around it keep the relationship going. Apple's model asks what happens when hardware growth, the Services mix and capital returns pull at different speeds.
What it does
Apple sells iPhone, Mac, iPad, wearables and home products, alongside Services. Hardware demand depends on upgrades, new customers and pricing. Services monetizes activity across the ecosystem. This study models the product categories separately before bringing their cash flows back together.
Why it might win
The thesis is that a broad installed base supports more than the next device launch. Services can grow with the continuing customer relationship. In the model, its higher assumed cash margin means a richer Services mix can improve overall cash conversion.
What could break
A slower replacement cycle can weigh on the largest revenue stream. Services must keep growing, while the valuation paid for future cash still matters. Repurchases use real cash, and employee share issuance offsets part of their effect.
01 / THE STORY
Follow the business before the stock.
Can a larger Services relationship and disciplined repurchases offset a slower device cycle?

Start with the device
iPhone is the main revenue engine, while other hardware categories add their own cycles. The model separates them so a stronger Mac or iPad story cannot silently stand in for the whole company.

Follow the customer beyond the sale
Services grows from ongoing use of the ecosystem. A faster-growing stream with a higher assumed cash margin can change the economics even without an extraordinary hardware cycle.

Bring it back to each share
The study funds repurchases from available cash and tracks compensation shares. The eventual outcome depends on operating cash, the shares left outstanding and the multiple investors are willing to pay.
Who pays, and why?
Device buyers
Pay for iPhone, Mac, iPad and wearables when they buy or upgrade.
Service users
Pay for subscriptions, apps and other services over time.
Developers and partners
Help make the ecosystem useful; some services involve partner economics.
Find the revenue engine.
Each business has a different path from customer activity to value per share. These are the levers used in the model.

iPhone
The largest hardware stream. Upgrades, new customers and selling prices shape its path.

Mac, iPad and wearables
Each product has its own replacement cycle. The model keeps their revenue paths separate.

Services
Ongoing use creates revenue beyond the original device purchase.

Repurchases
Cash spent on buybacks can reduce shares after employee issuance is counted.
Product revenue categories are reported; cash margins by category and future growth are analyst assumptions. See dated sources
THE OWNERSHIP STORY
Follow the share count.
A business can grow.
Your share of it can change, too.
MODELED SHARES OUTSTANDING
DO THE BUYBACKS ADD VALUE?
Same business assumptions. The no-buyback case keeps the unspent cash.
Test the buyback assumptions
THE BUSINESS
How the story becomes a business.
Sell and replace devices
Product demand and pricing drive the hardware revenue streams.
Grow the Services relationship
A larger Services mix can raise overall cash conversion under the model's margin assumptions.
Convert cash into ownership
Funded buybacks reduce cash and shares while compensation adds shares back.
Loading reported business flow…
THE VALUATION MODEL
One business.
Three possible futures.
The business is the same. The assumptions change.
Choose a case, then make it your own.
Each number is a modeled ending, not a reported result.
What needs to happen?
Change the main drivers here. Then view the money flow or open the full model below.
Explore the other businesses
Give each business its own growth and cash margin. Every change flows into this same scenario.
Reference price —
SEE THE MODEL IN MOTION
See where the money goes.
The sliders above shape one scenario. Follow its annual money flow below, then open the full inputs if you want to go deeper.
Open the interactive diagramMove through the modeled years
Follow the money, year by year.
Each ribbon uses the same dollar scale across this scenario. Move through the modeled years to see what changes.
Swipe sideways to follow the full flow →
This diagram traces annual revenue into cash and owner economics; ribbons do not represent payments between these businesses.
Advanced assumptions and annual tableAdjust the full model and inspect each year
THE THESIS TEST
What to watch for?
- 01
The hardware cycle
Follow revenue across product categories. Separate a broad improvement in demand from strength in a single launch.
- 02
The Services mix
Watch Services growth relative to hardware and evidence of durable cash conversion. Allocated category cash margins are assumptions.
- 03
Cash into fewer shares
Compare operating cash generation, repurchase spending, execution prices and diluted shares. Gross purchases are not the net reduction.
IN THE TECHBREAKDOWNS SYSTEM
Where Apple sits.
Follow Apple into the market it serves, the indices that track its stage, and the model portfolios that hold it.
Checkout & payments
Apple Pay wallet and tokenized card credentials; not the card issuer
Also at this stage Adyen, dLocal, Fiserv, Global Payments, PayPal, Block and 8 more.
Index member
Apple is 9.81% of the cap-weight index and 1.30% of the equal-weight index, as of Oct 6, 2026.
Cannibals
Held since Aug 12, 2026: +8.3% from its logged entry price through Oct 1, 2026. It passes the current screen.