dLocal
The price of friction.
One connection makes emerging-market payments easier. But as the biggest customers grow, they want to pay less.
In the systemCheckout & paymentsWhere it sits ↓
Research & model · · $14.17 dated reference
THE STORY IN PICTURES
Who keeps the value
when payments get easier?
Follow the merchant, the fee and the cash that belongs to shareholders.
 Enlarge graphic
THE CUSTOMER PROBLEM
Global products. Local ways to pay.
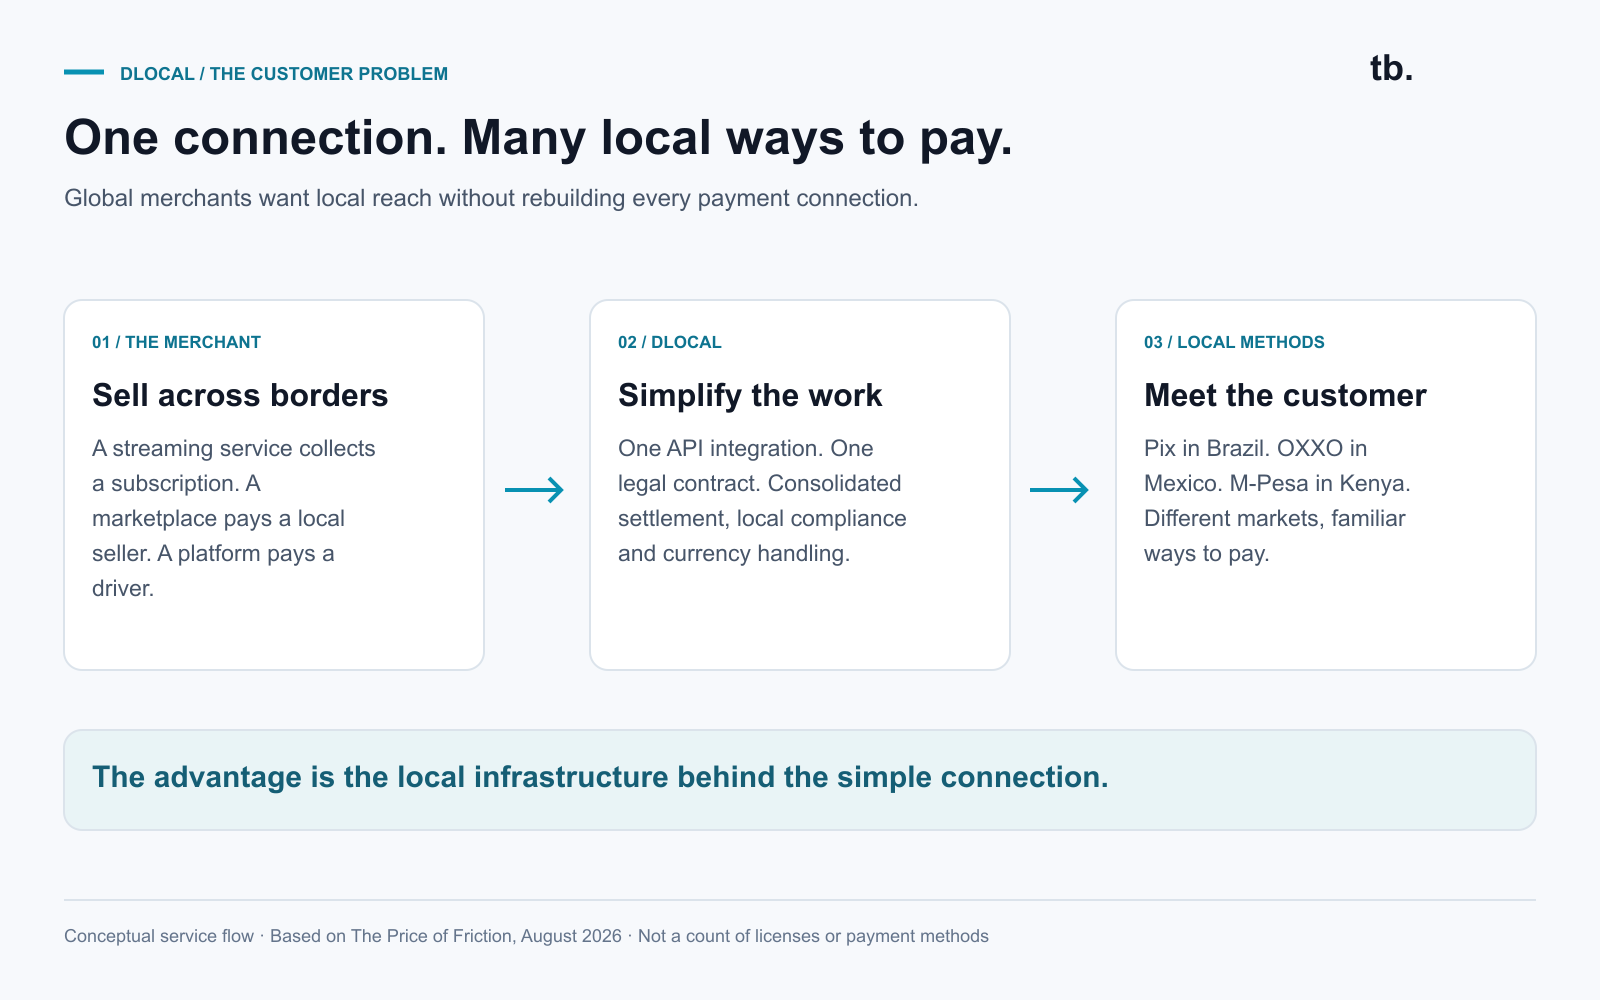
Pix, OXXO and M-Pesa solve local needs. dLocal gives a merchant one connection across payment methods, compliance and settlement.
Conceptual service flow adapted from the August 2026 article. This is not a count of licenses, direct connections or payment methods.
 Enlarge graphic
THE ECONOMIC TENSION
Volume grows faster than the fee it keeps.
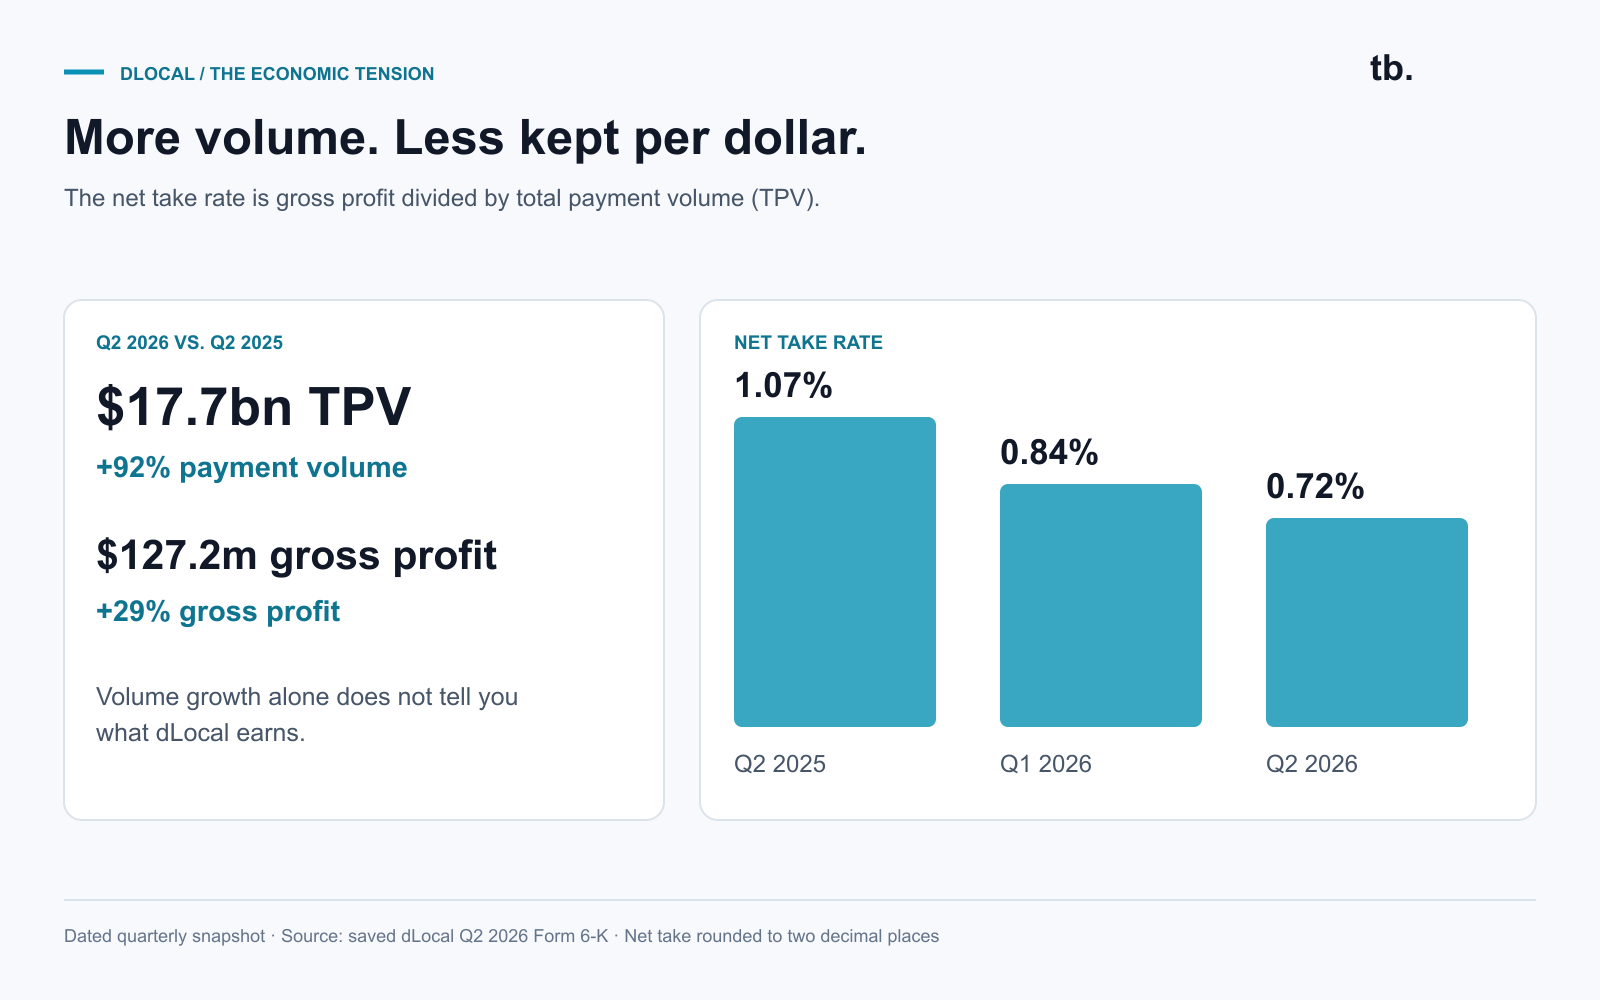
In the article’s Q2 2026 snapshot, TPV grows 92% to $17.7bn while net take falls to 0.72%. Follow gross profit dollars as well as volume.
Net take rate means gross profit divided by TPV, not revenue divided by TPV. These are dated quarterly figures.
 Enlarge graphic
THE COMPETITIVE FIGHT
The next dollar is not guaranteed.
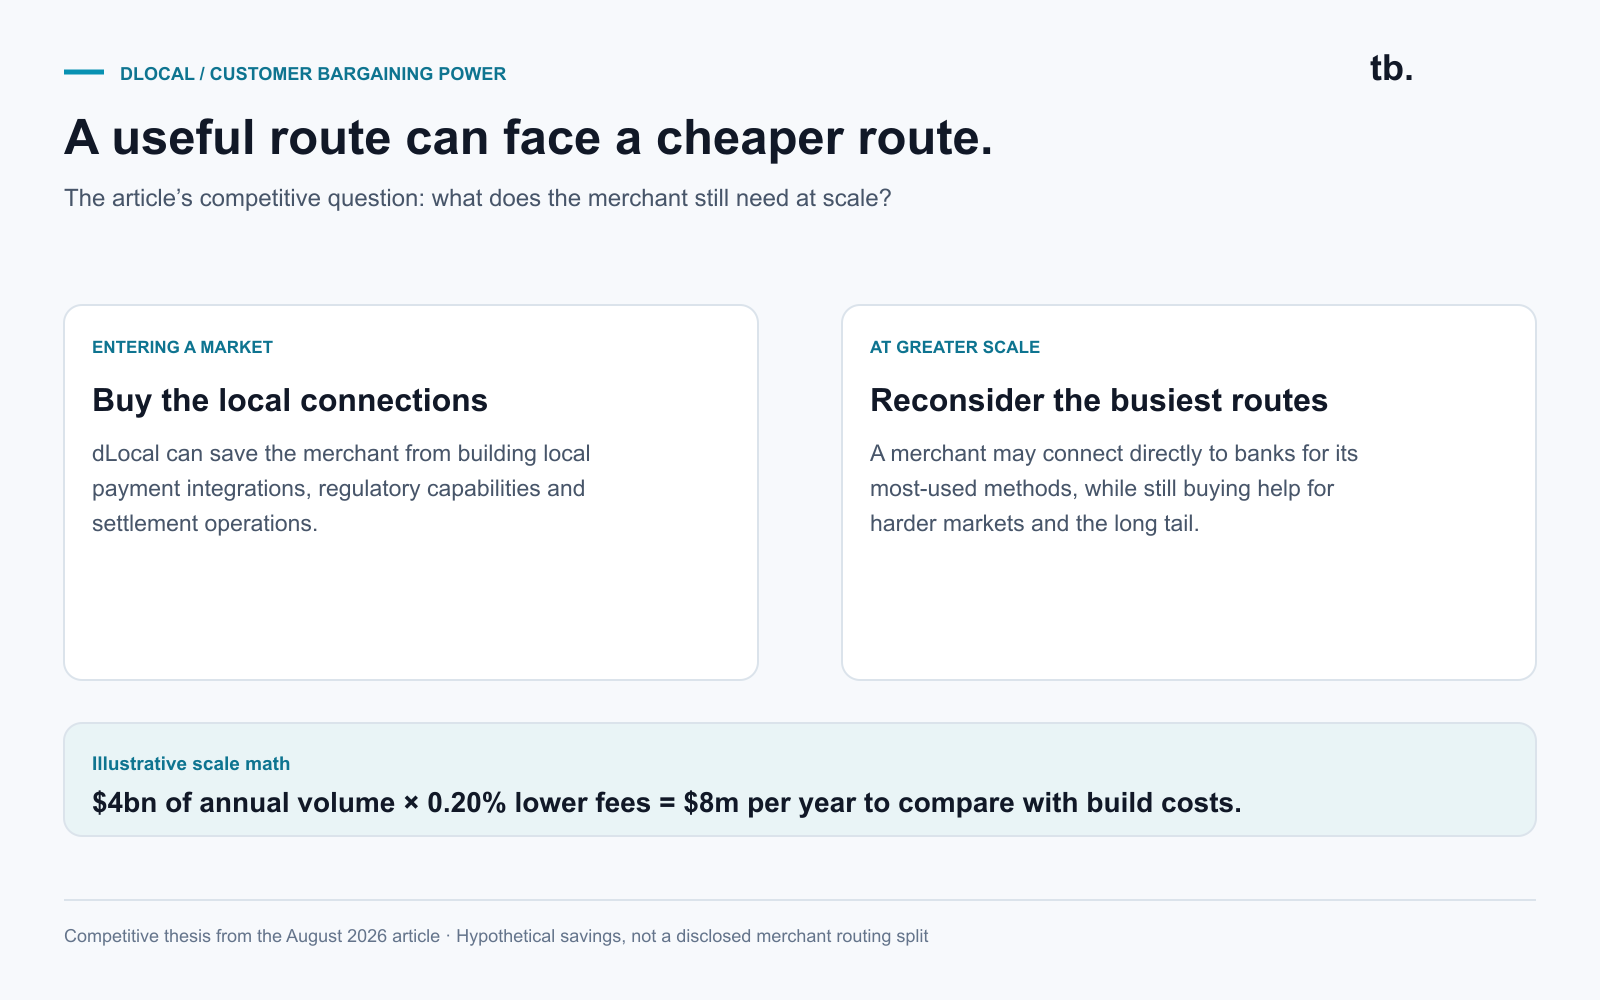
A large merchant can use dLocal to enter a country, then consider direct bank connections for its busiest routes. The apparent whitespace is also a competitive battleground.
Competitive thesis, not a disclosed merchant routing split. The $8m savings example is hypothetical and must be weighed against build and compliance costs.
 Enlarge graphic
OWNER ECONOMICS
Merchant money is not owner money.
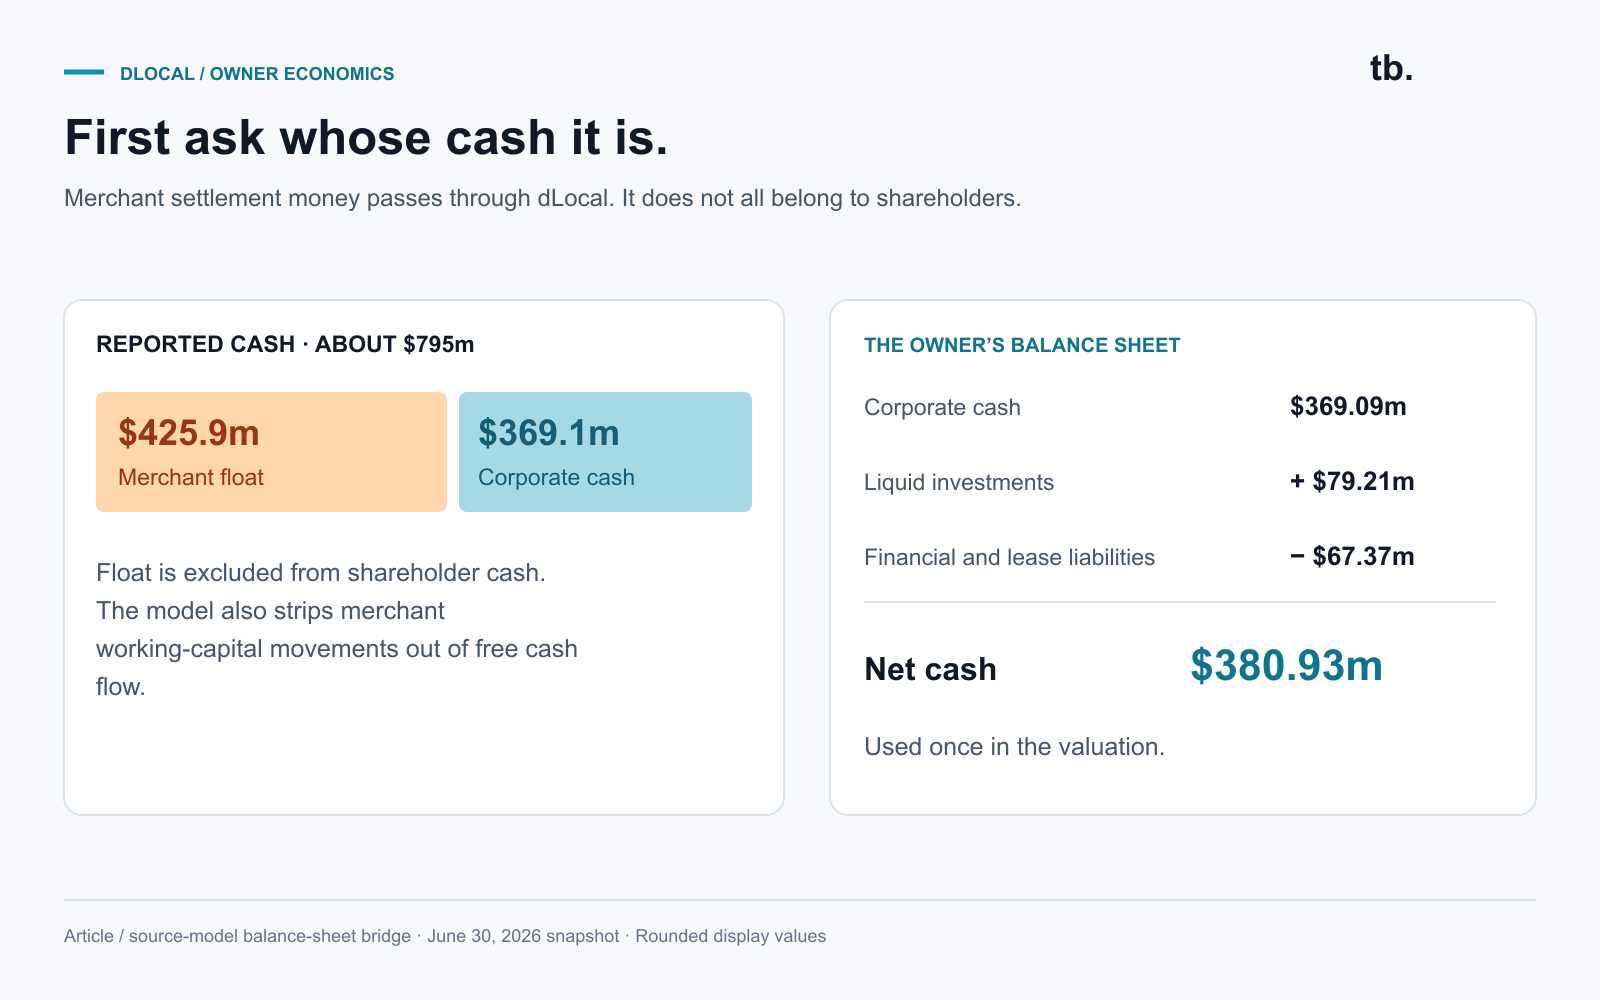
The article separates about $426m of merchant float from $795m of reported cash. Corporate cash, liquid investments and debt produce about $381m of net cash.
Balance-sheet cash is different from annual cash flow. The article’s ~$155m owner FCF estimate separately removes float movements and charges equity pay.
 Enlarge graphic
VALUATION VS. BUSINESS QUALITY
A compelling spreadsheet. A portfolio pass.
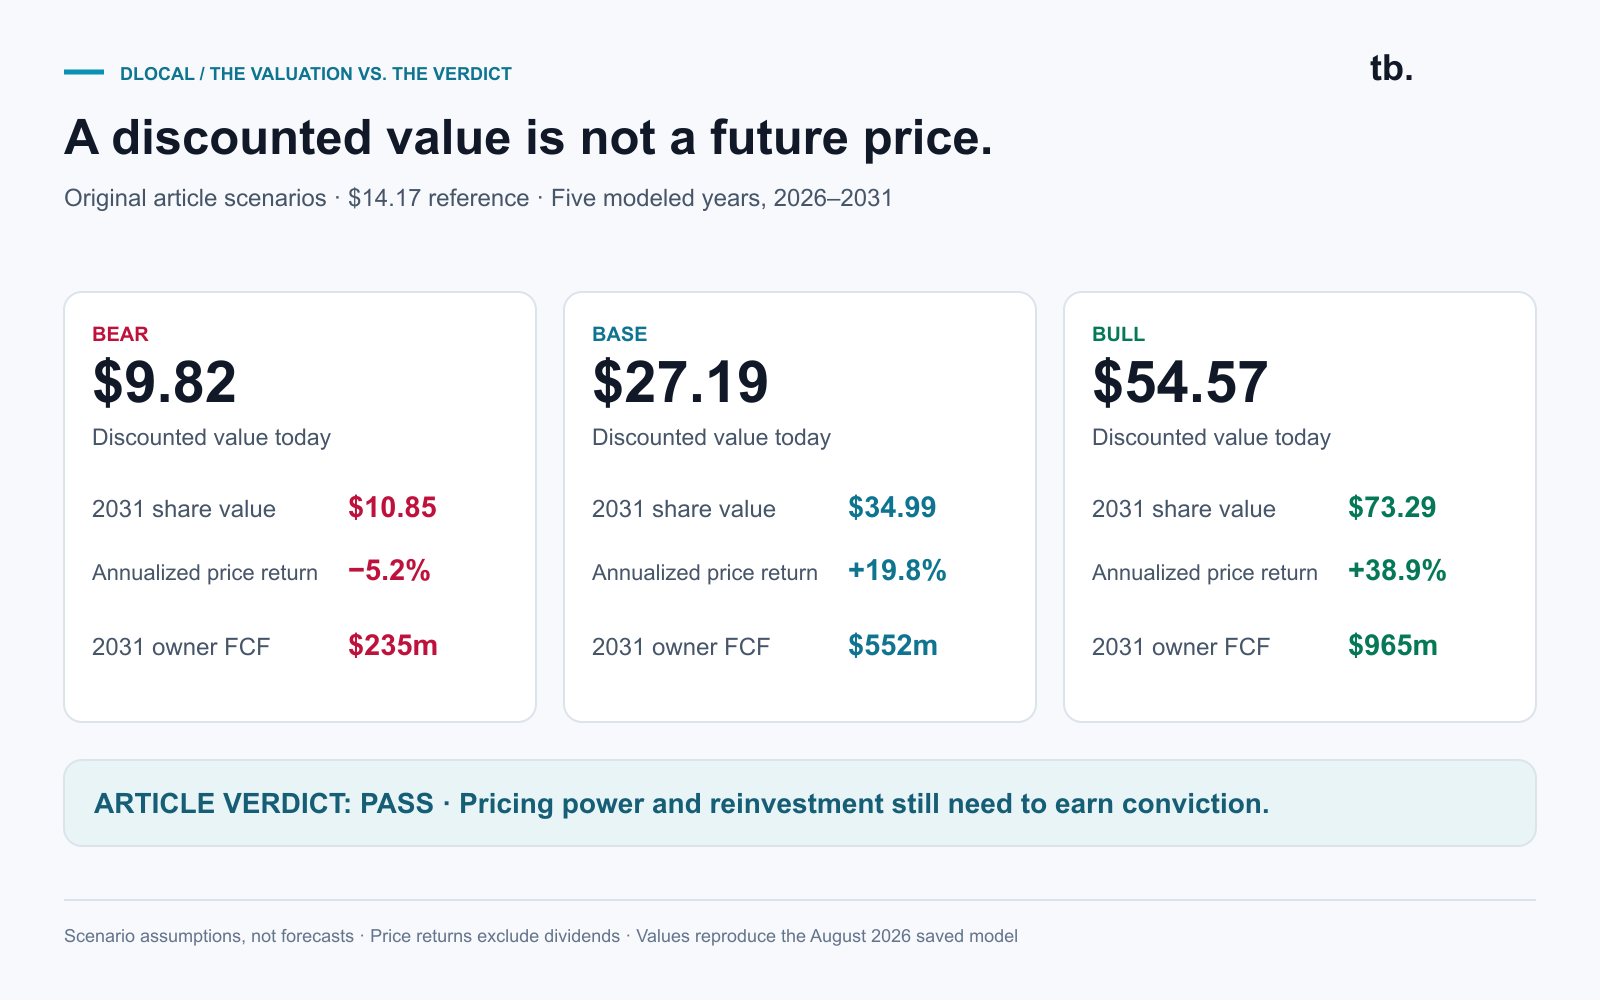
The article’s base DCF value is $27.19 against a $14.17 reference price. Its portfolio verdict is still PASS: attractive valuation does not settle the questions about pricing power and reinvestment.
These are the original article’s discounted values. The model below separately labels 2031 share values and five-year price returns; none is a live quote.
THE OVERVIEW
First, understand
the business.
The product, the advantage,
and the pressure on price.
A global merchant wants to accept Pix in Brazil, cash vouchers in Mexico and mobile money in Kenya. It can build every local connection—or hire dLocal to handle the maze.
What it does
dLocal connects international merchants to emerging-market payment methods. Pay-ins collect customer money; payouts send local currency to drivers, sellers and other recipients. One API, one contract and consolidated settlement simplify the work.
Why it might win
The hard part is the accumulated local infrastructure: entities, regulatory permissions, bank relationships, compliance and foreign-exchange handling. That work can make dLocal a useful partner across difficult markets.
What could break
The biggest customers negotiate lower fees and may connect directly to local banks. Standardized payment rails can make entry easier for competitors. The article likes the service but questions how much pricing power will survive.
01 / THE STORY
Follow the business before the stock.
Can volume and new markets outgrow the pressure on every transaction?
Make the local complexity disappear
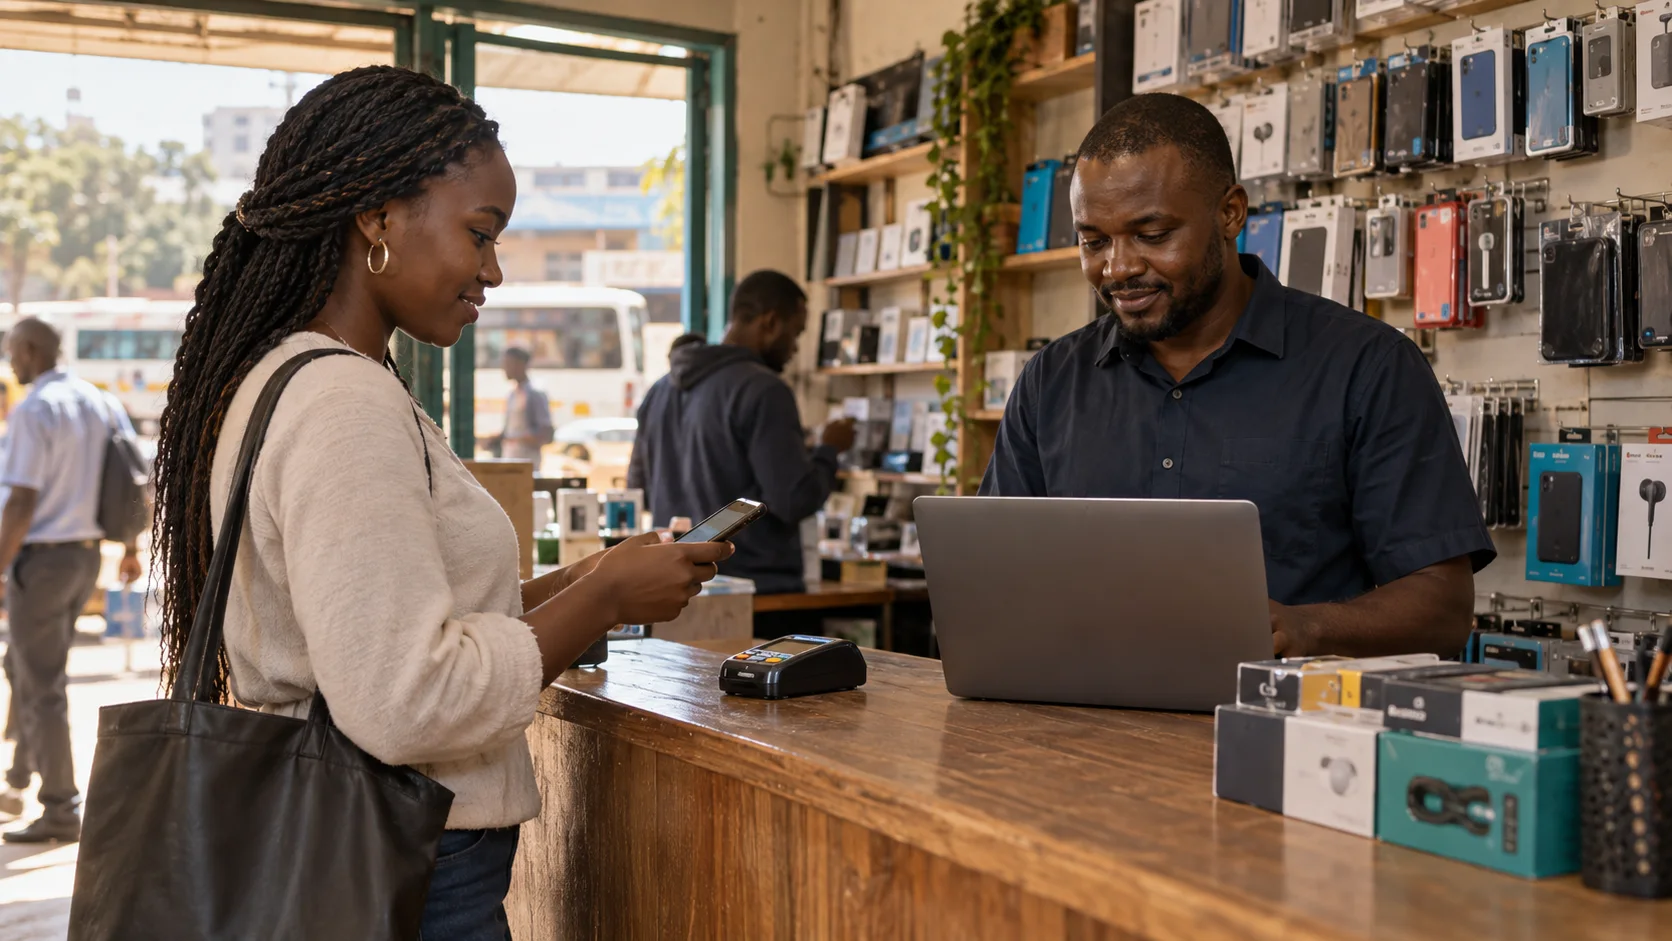
A global merchant wants to collect a payment in Brazil or pay a driver in Kenya. dLocal connects the local methods, compliance and settlement behind one integration. The customer buys a simpler route into the market.

The biggest customers negotiate hardest
More merchant volume can trigger lower contract prices. At enough scale, a merchant can route its largest payment methods directly to local banks. Growth strengthens the customer’s bargaining power as well as dLocal’s business.

Count the cash that belongs to owners
Merchant settlement balances pass through dLocal’s accounts. They are not spare corporate cash. The article strips that float out, charges stock compensation and asks whether the remaining cash justifies the price.
Who pays, and why?
Global merchants
Pay dLocal to collect and disburse money without building every local connection.
Local consumers & recipients
Use familiar payment methods or receive money in their local currency.
Banks & local payment partners
Provide the local rails, clearing and settlement that make the transaction possible.
Find the revenue engine.
Different services feed one payments business. They are not separately modeled revenue segments.
Pay-ins
Accept local bank transfers, cards, mobile money and cash-based methods.
Payouts
Pay sellers, drivers and other recipients using local currencies and methods.
Compliance & settlement
Connect local banking relationships, regulatory permissions and currency handling.
Owner economics
Turn gross profit into cash after operating costs, investment and equity pay.
The article’s service descriptions, connected to the model’s operating drivers. See dated sources
THE BUSINESS
How the story becomes a business.
Connect the payment
One API, one contract and consolidated settlement connect a global merchant to local payment methods and payouts.
Keep a small spread
TPV is money processed. Gross profit is what remains after the local cost of processing; gross profit ÷ TPV is the net take rate.
Turn that spread into owner cash
Operating costs, tax, investment and stock compensation come before owner free cash flow. Customer float stays outside the valuation.
THE ARTICLE’S ILLUSTRATIVE $100 PAYMENT
Gross profit ÷ TPV = a 0.72% net take rate. This example is not an actual Pix tariff or the quarter’s exact gross revenue take.
Loading reported business flow…
THE VALUATION MODEL
One business.
Three possible futures.
The business is the same. The assumptions change.
Choose a case, then make it your own.
Each number is a modeled ending, not a reported result.
What needs to happen?
Change the main drivers here. Then view the money flow or open the full model below.
Reference price —
SEE THE MODEL IN MOTION
See where the money goes.
The sliders above shape one scenario. Follow its annual money flow below, then open the full inputs if you want to go deeper.
Open the interactive diagramMove through the modeled years
Follow the money, year by year.
Each ribbon uses the same dollar scale across this scenario. Move through the modeled years to see what changes.
Swipe sideways to follow the full flow →
Gross profit = TPV × net take rate. Ribbons start at gross profit, after payment processing costs. Owner cash already charges stock compensation and excludes merchant float. The starting year is a research estimate.
Advanced assumptions and annual tableAdjust the full model and inspect each year
THE THESIS TEST
What would change the view?
- 01
Gross profit outruns fee compression
Watch gross profit dollars alongside TPV. The article’s net take rate falls from 1.07% in Q2 2025 to 0.72% in Q2 2026. More volume is useful only if the remaining economics are attractive.
- 02
Large merchants keep choosing dLocal
The article reports 188% TPV retention, but the top ten customers also account for 61% of revenue. Track renewals, pricing step-downs and evidence that large merchants are moving their busiest routes directly to banks.
- 03
The regulatory advantage earns reinvestment
New markets and local compliance may defend the business. Test that against payment standardization, competition and the article’s concern about returning cash while a large expansion opportunity remains.
IN THE TECHBREAKDOWNS SYSTEM
Where dLocal sits.
Follow dLocal into the market it serves, the indices that track its stage, and the model portfolios that hold it.
Checkout & payments
Local payment acceptance and payouts in emerging markets
Also at this stage Adyen, Fiserv, Global Payments, PayPal, Block, Shift4 and 8 more.
Index member
dLocal is 0.03% of the cap-weight index and 1.37% of the equal-weight index, as of Oct 6, 2026.