
Marketplace & Instacart+
The app, search, recommendations, checkout and membership bring households back. More completed orders enlarge the base for fees and ads.
Money leverOrders · basket size · net transaction revenue
Every order is a chance to earn from the shopper, the brand, and the retailer. Follow the money through the business, then decide what growth is actually worth per share.
In the systemStores & marketplacesShipping & deliveryReinvestors portfolioWhere it sits ↓
Instacart helps a household shop at a retailer, coordinates fulfillment, and sells brands and grocers tools around that trip. The groceries belong to the retailer. The investment story is whether more trips can also support more advertising and retailer technology—then leave more cash for each share.
Start with who shops, who pays, and who fulfills the order. The financial model groups these offerings into two reported revenue categories.
Instacart tries to make the next trip easier to start, fill and finish.

Pay service and delivery fees or join Instacart+.
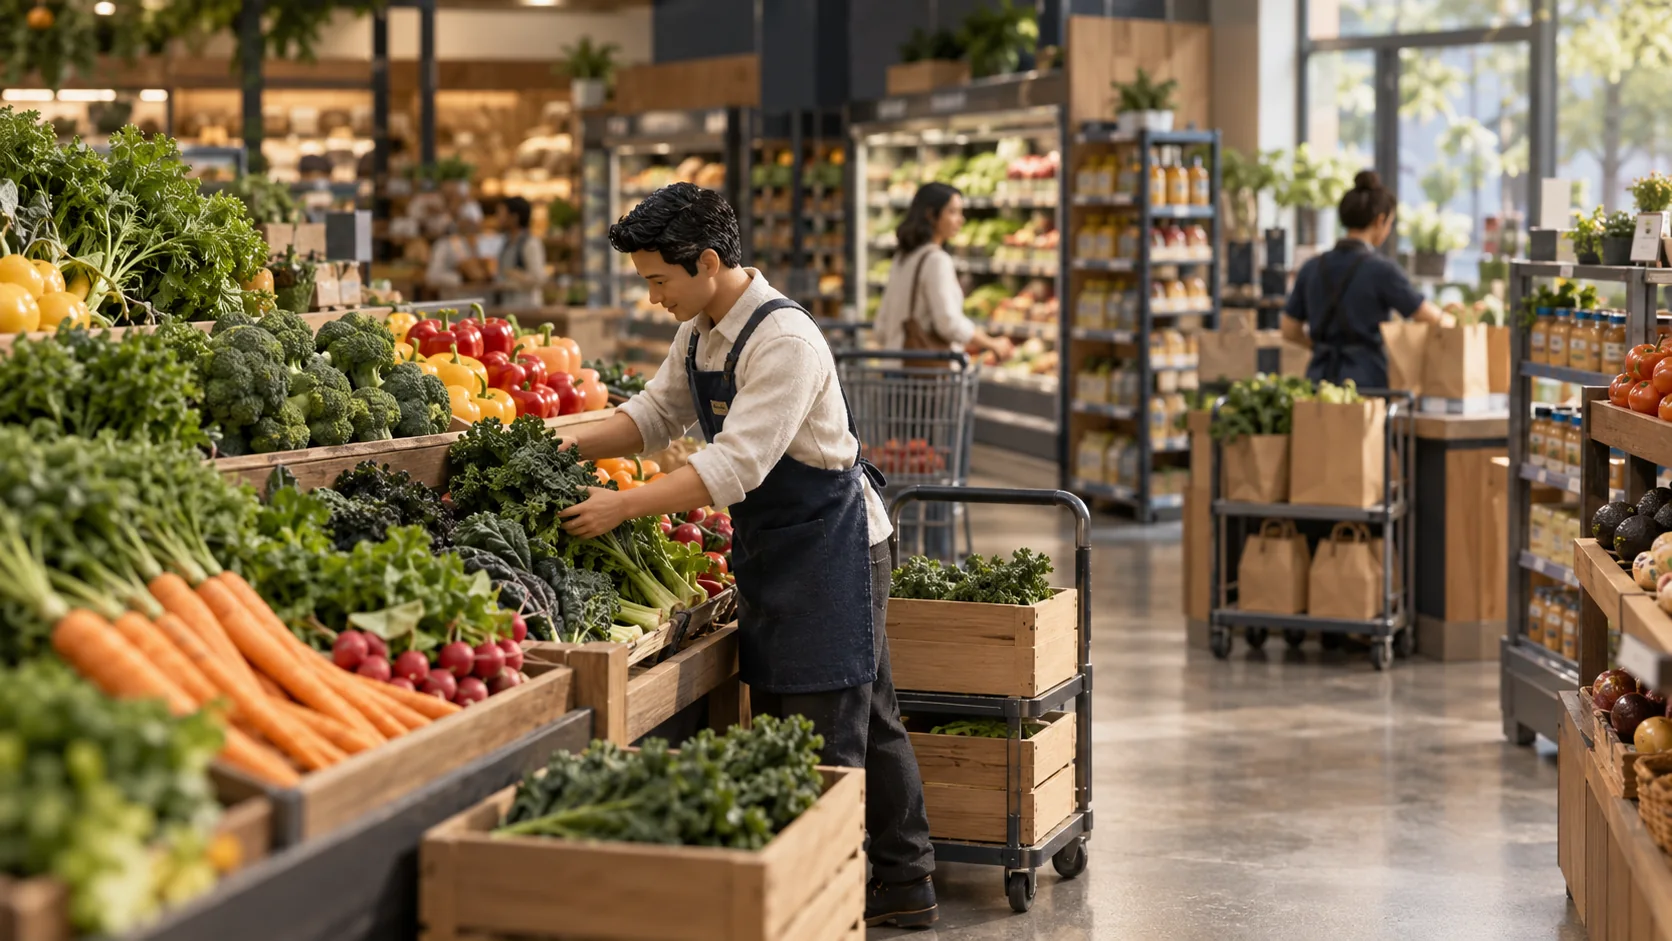
Sell the goods; may pay for marketplace, fulfillment or software.
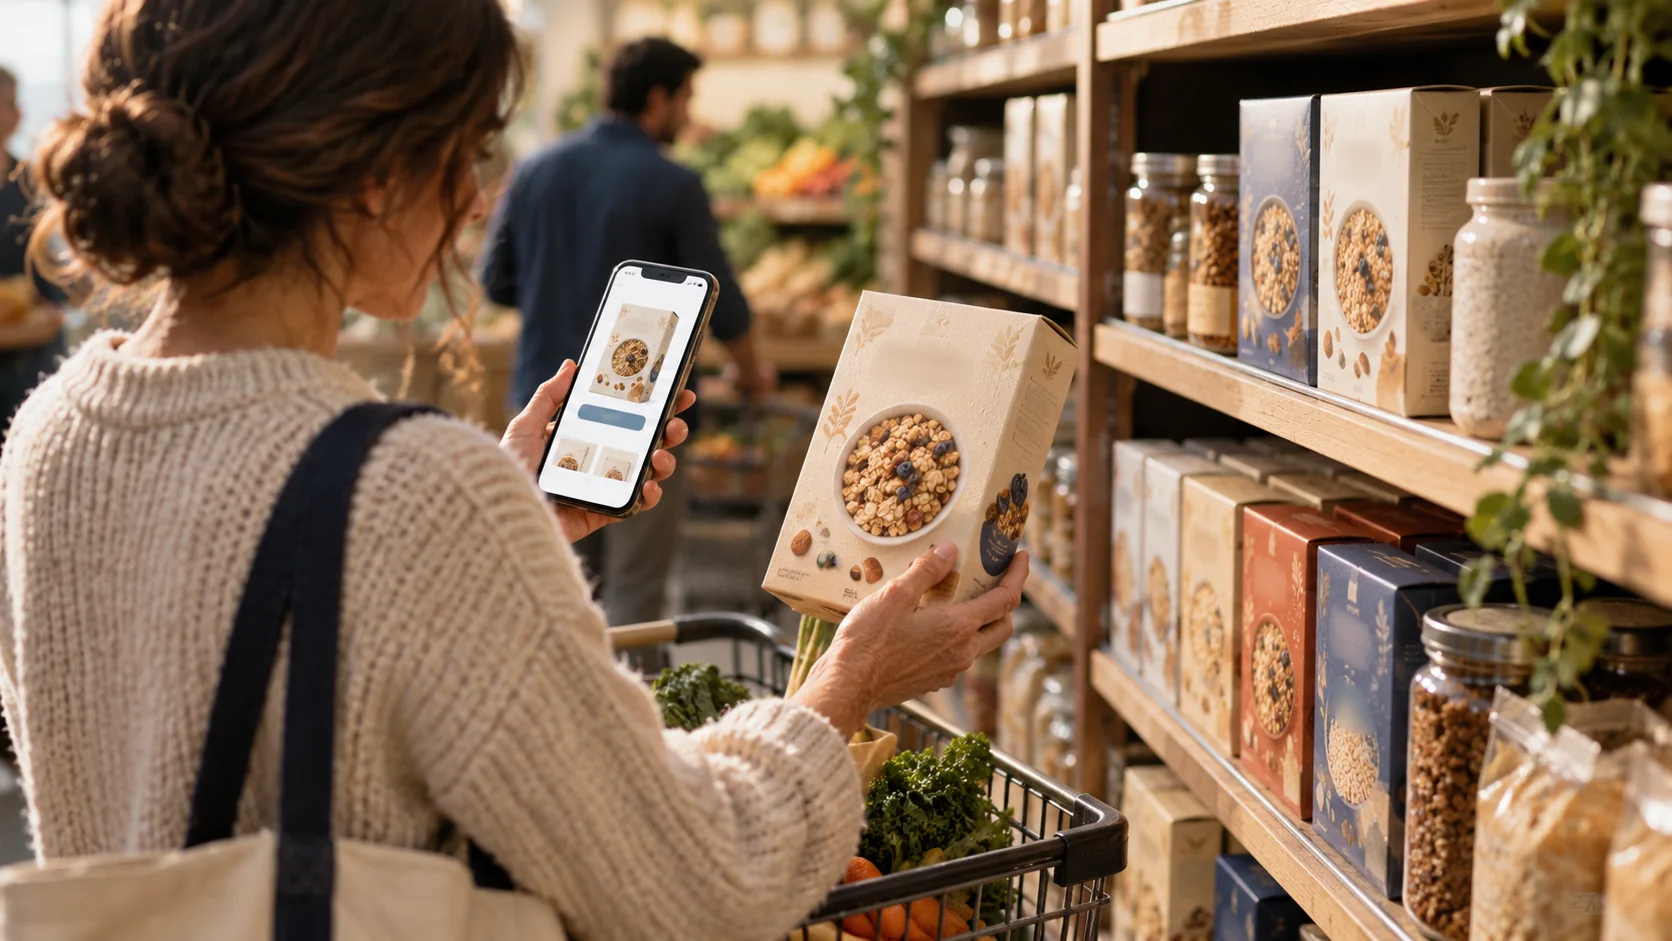
Buy placements where grocery choices are made.
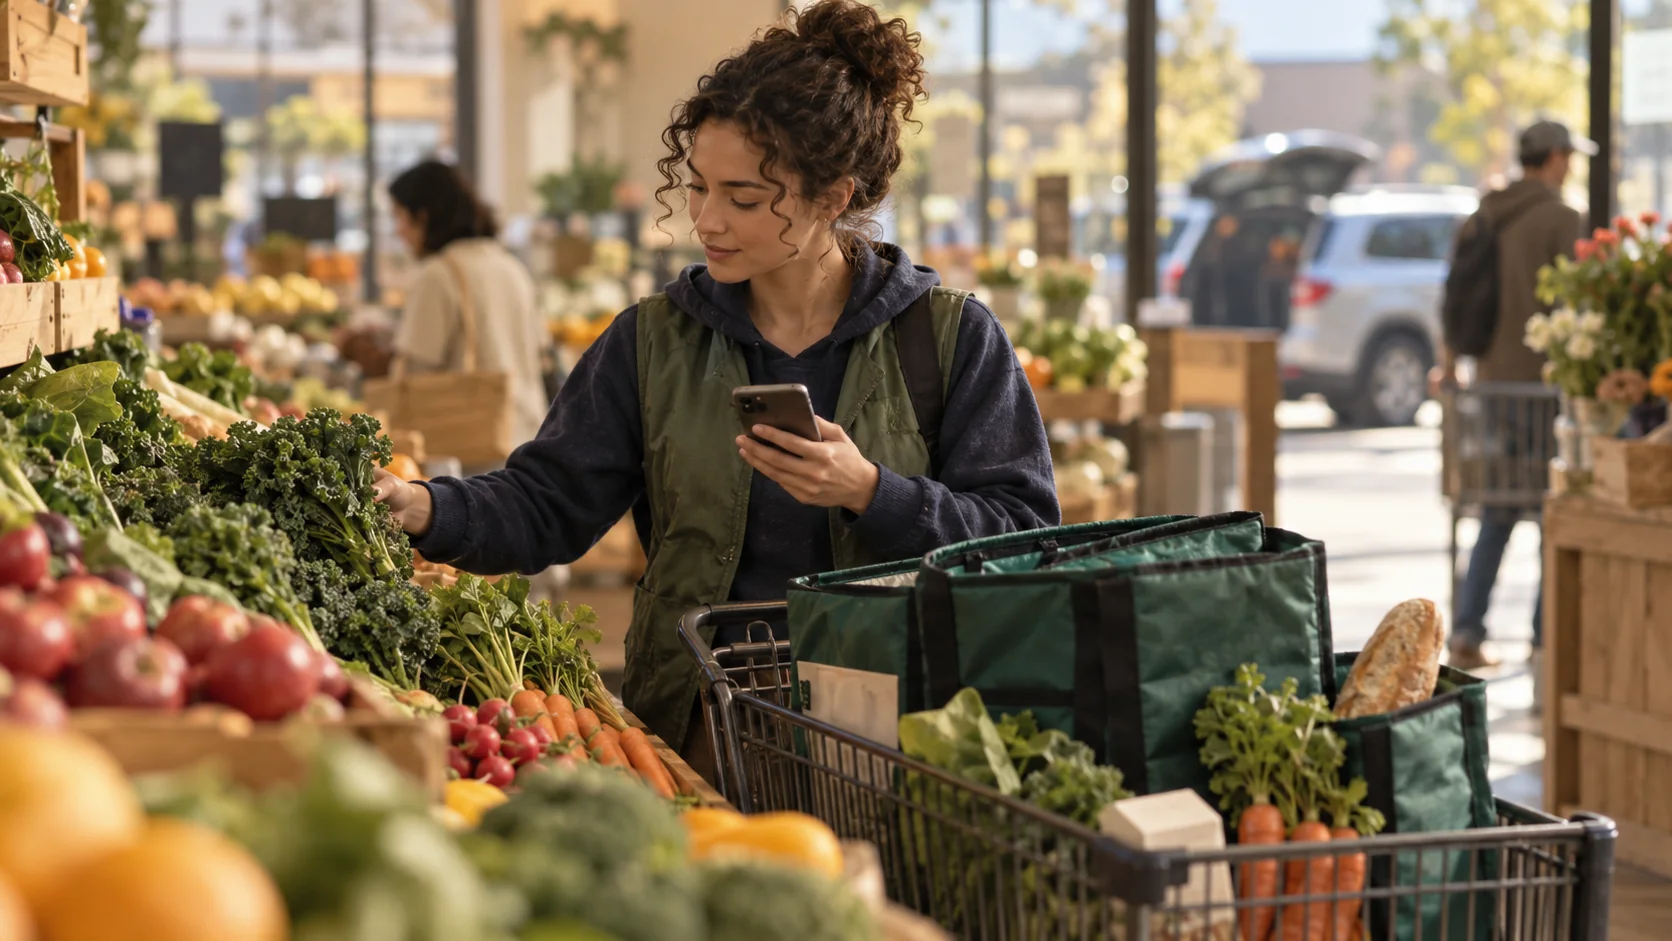
Instacart calls them shoppers. Their pay reduces net transaction revenue.
Products can reinforce one another, but Instacart does not report each one as a separate financial segment.
The app, search, recommendations, checkout and membership bring households back. More completed orders enlarge the base for fees and ads.
Storefront Pro, fulfillment tools and FoodStorm help grocers run their own online stores, pickup and prepared-food orders.
Instacart Ads sells sponsored placements on its marketplace, retailer sites, other platforms and Caper Cart screens. Carrot Ads helps retailers sell media.
Caper Carts, Scan & Pay and Carrot Tags reach the physical aisle; insights and AI tools connect more retailer operations. Repeat deployments matter more than a pilot announcement.
First, orders must keep growing. Next, brands and retailers must pay for useful tools around those orders. Finally, the extra revenue must survive fulfillment costs, partner payments and employee share awards. That last step is what common shareholders own.
Test the thesis ↓THE STORY IN PICTURES
Follow the order, then follow the money.
 Enlarge graphic
THE CUSTOMER
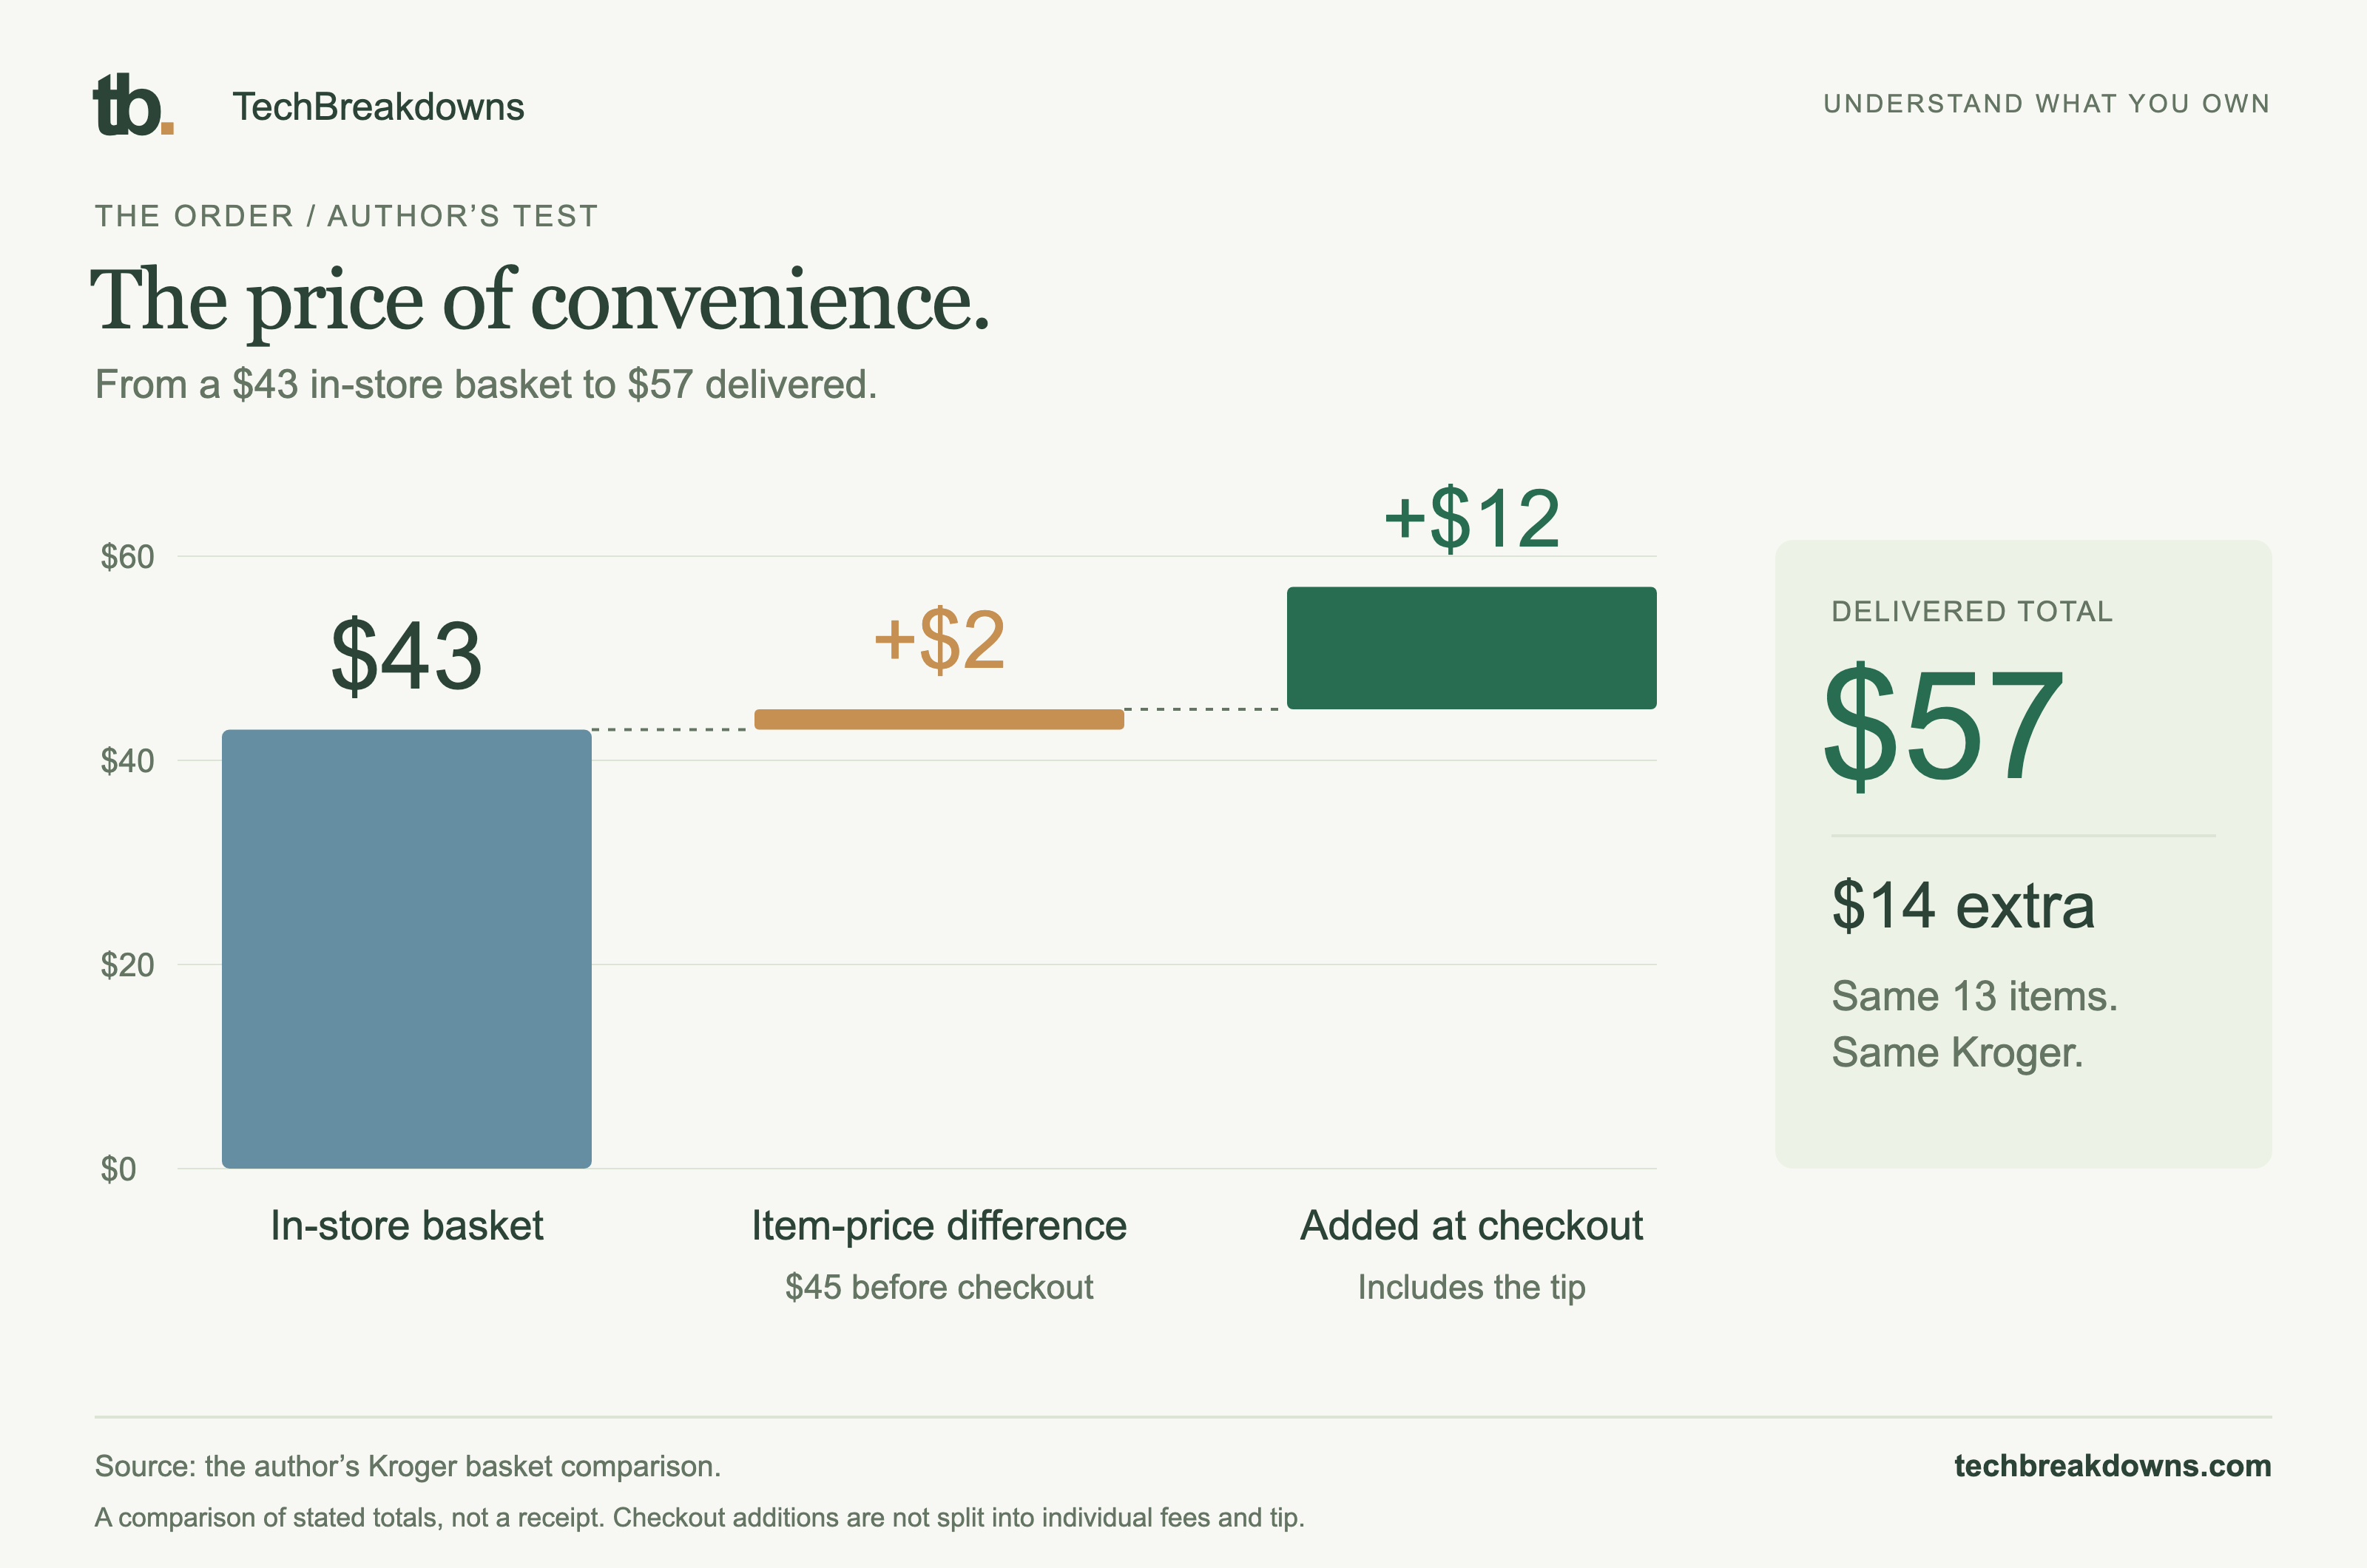
Convenience has a price. My same 13-item Kroger basket cost $43 in store and $57 delivered, including the tip. The investment question starts with whether the experience is worth coming back for.
One personal basket comparison, not a universal delivery markup. The $12 checkout addition includes the tip; individual fees are not separated.
the author’s Kroger basket comparison.
 Enlarge graphic
THE BUSINESS
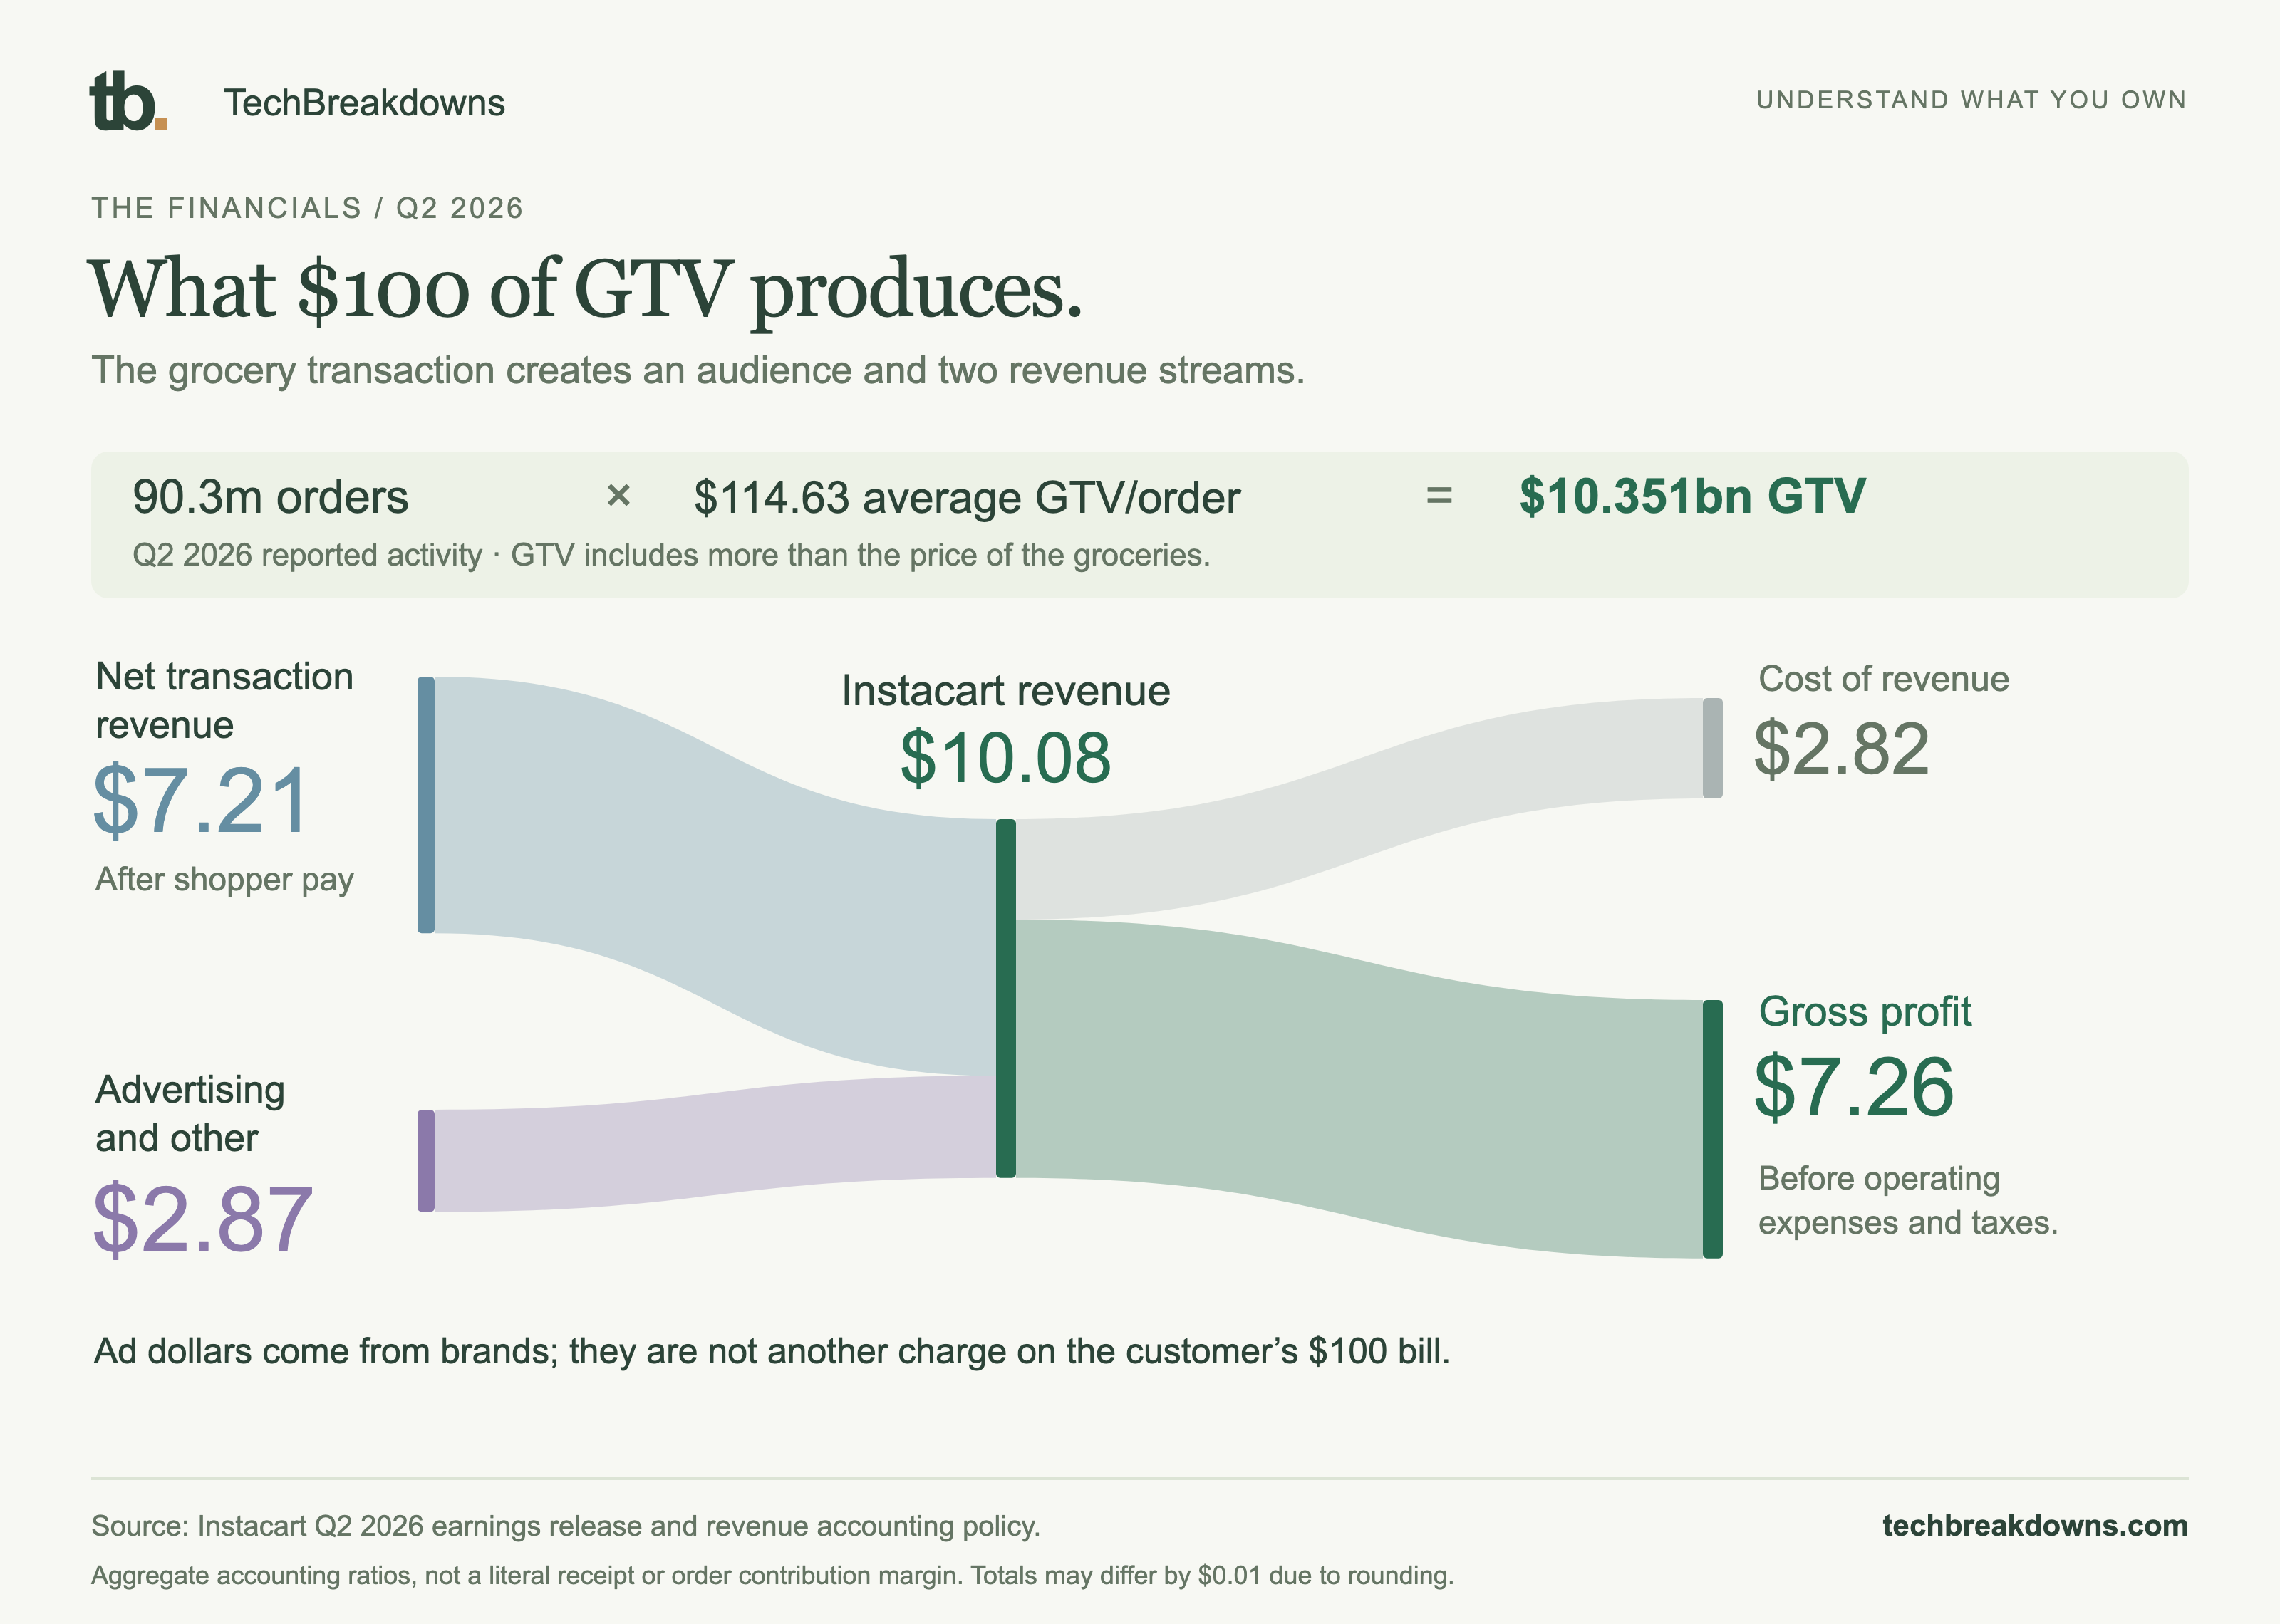
For every $100 of Q2 transaction value, Instacart recorded $7.21 of net transaction revenue and $2.87 of advertising and other revenue. Brands are another payer around the basket.
Q2 2026 aggregate ratios to GTV, not a literal receipt. Shopper pay is already netted from transaction revenue. Gross profit still has to fund operating expenses.
Instacart Q2 2026 earnings release and revenue accounting policy.
 Enlarge graphic
THE TECHNOLOGY
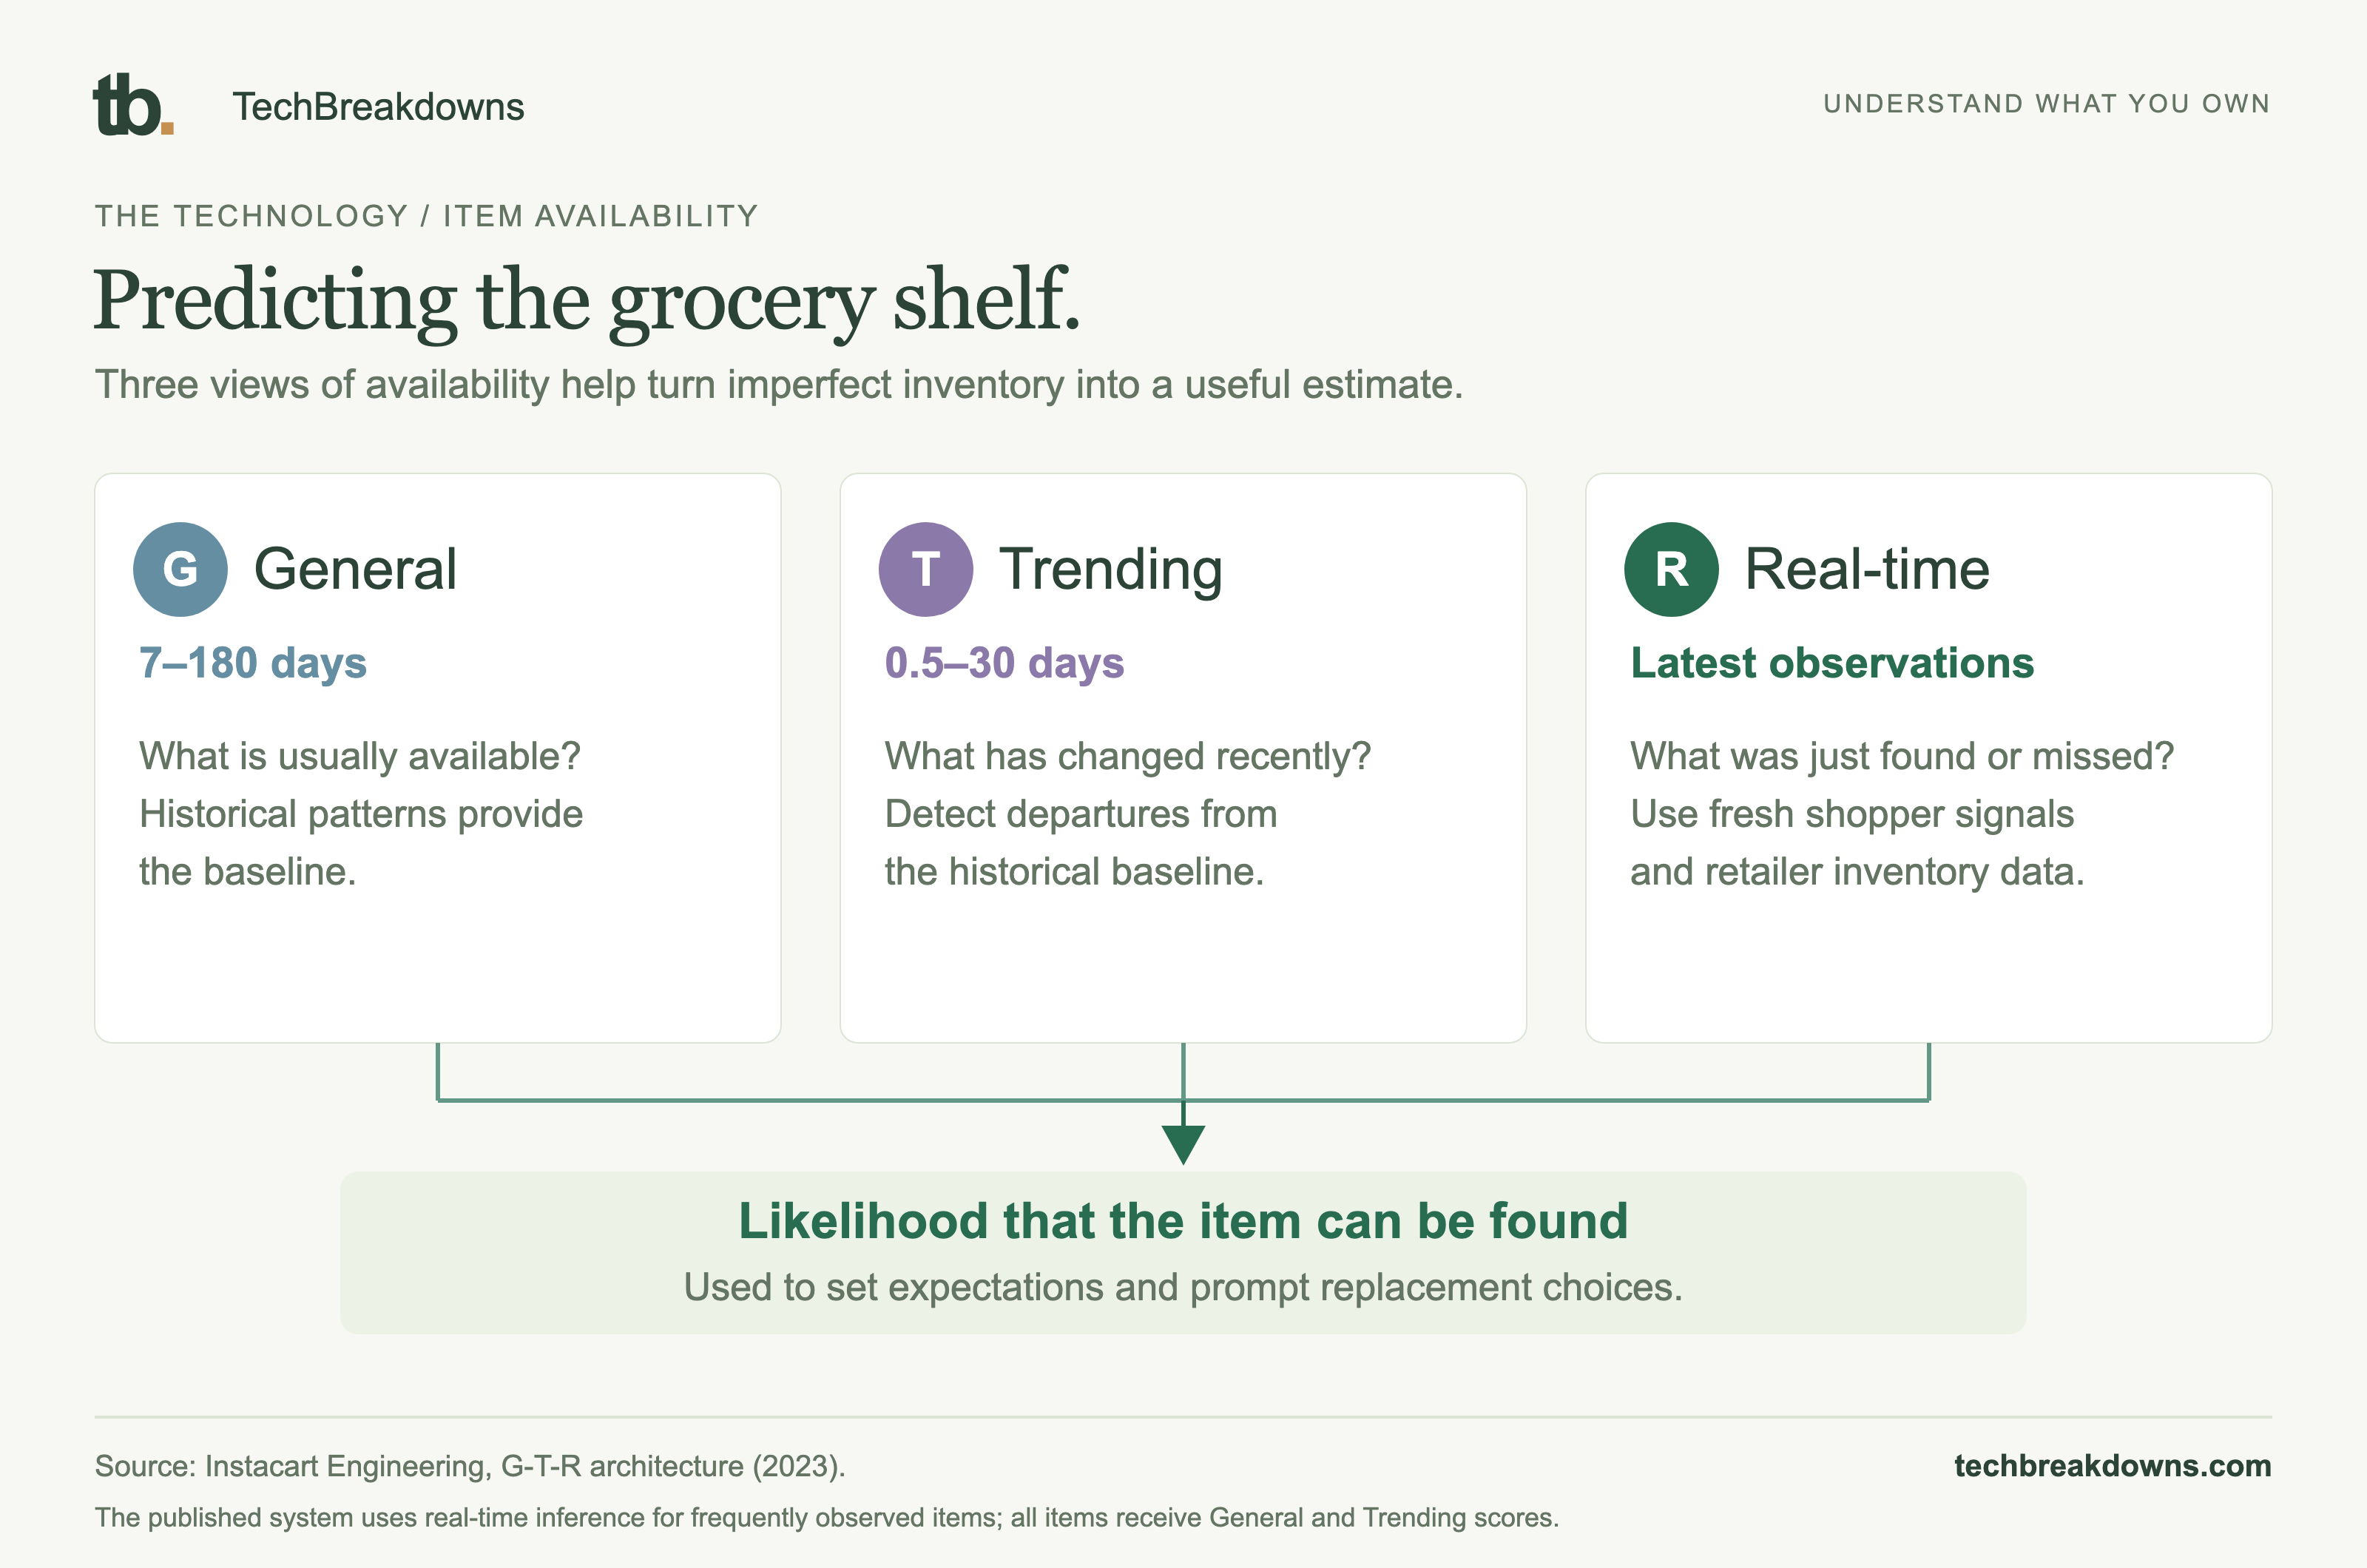
A digital catalogue cannot tell you whether the last carton of milk is still on the shelf. Instacart combines historical patterns, recent changes and fresh observations to estimate availability.
Instacart Engineering’s 2023 description of the G-T-R architecture. Not every item receives a real-time score.
 Enlarge graphic
THE OPPORTUNITY
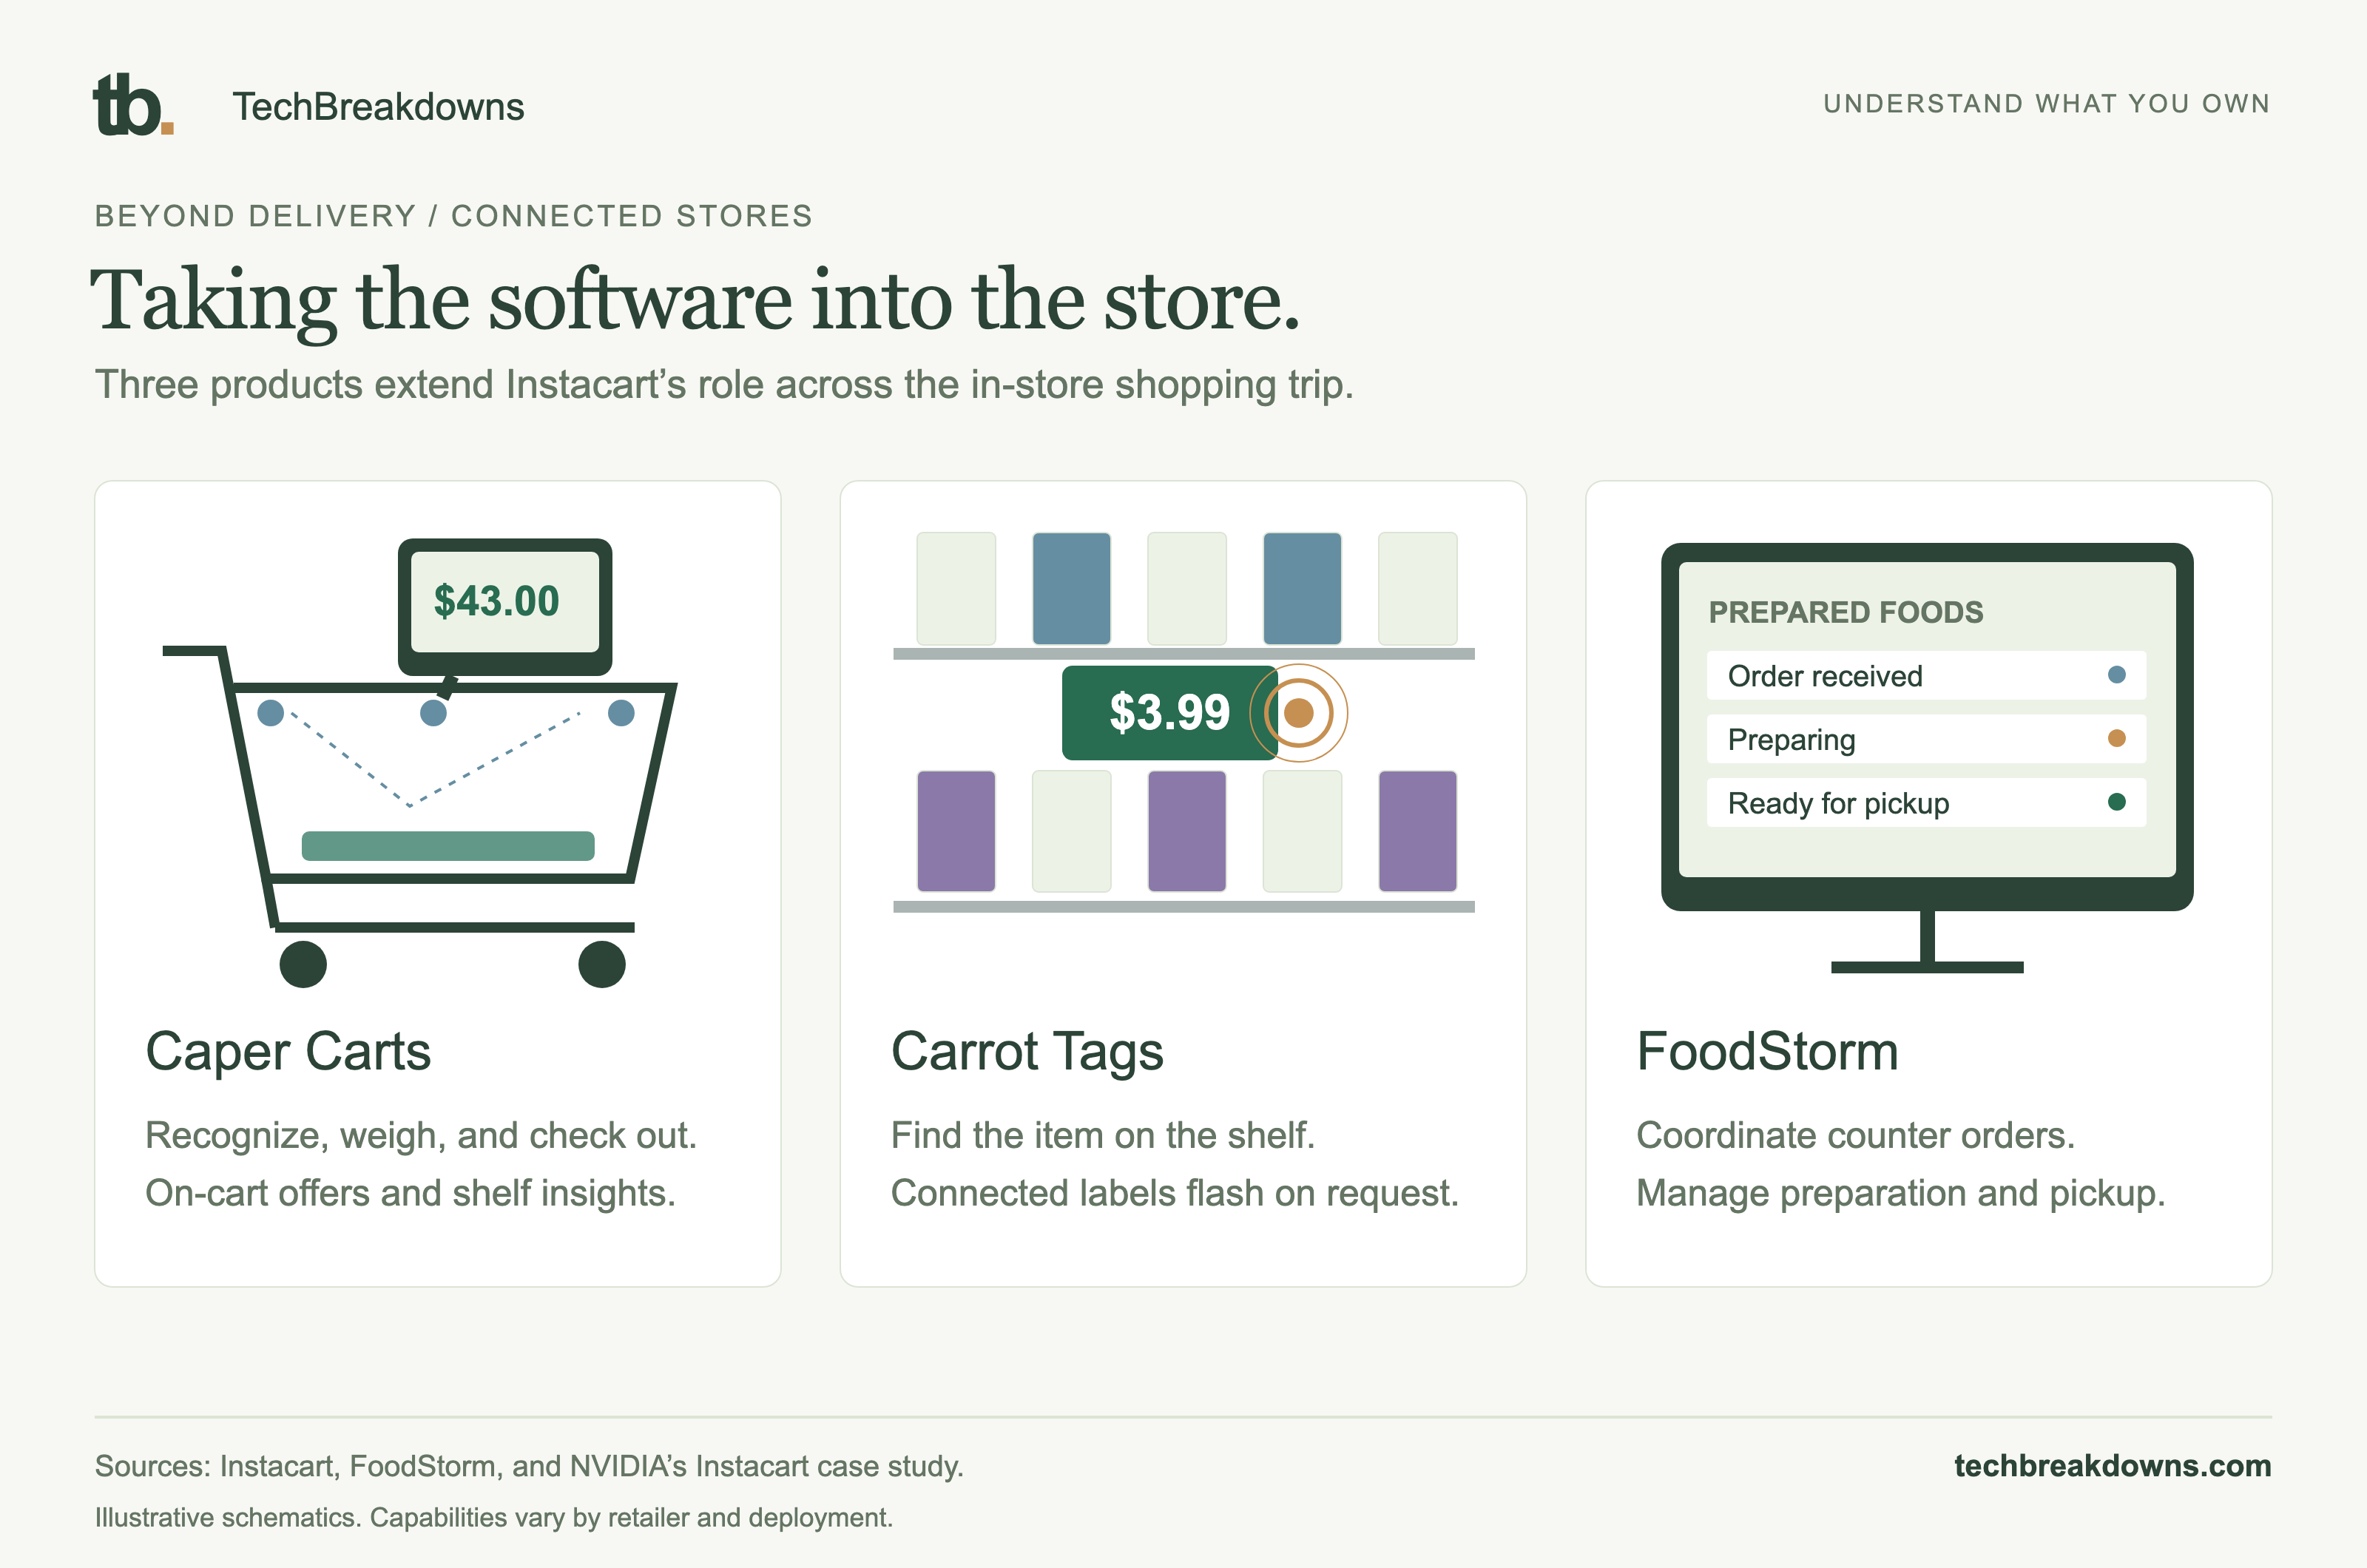
Caper Carts, Carrot Tags and FoodStorm extend the software into shopping, item discovery and prepared-food orders. The opportunity only becomes an investment case if adoption produces repeatable economics.
Illustrative product schematics. Capabilities vary by retailer. Caper store counts and revenue per store in our model are assumptions, not disclosed deployments.
 Enlarge graphic
THE OWNER
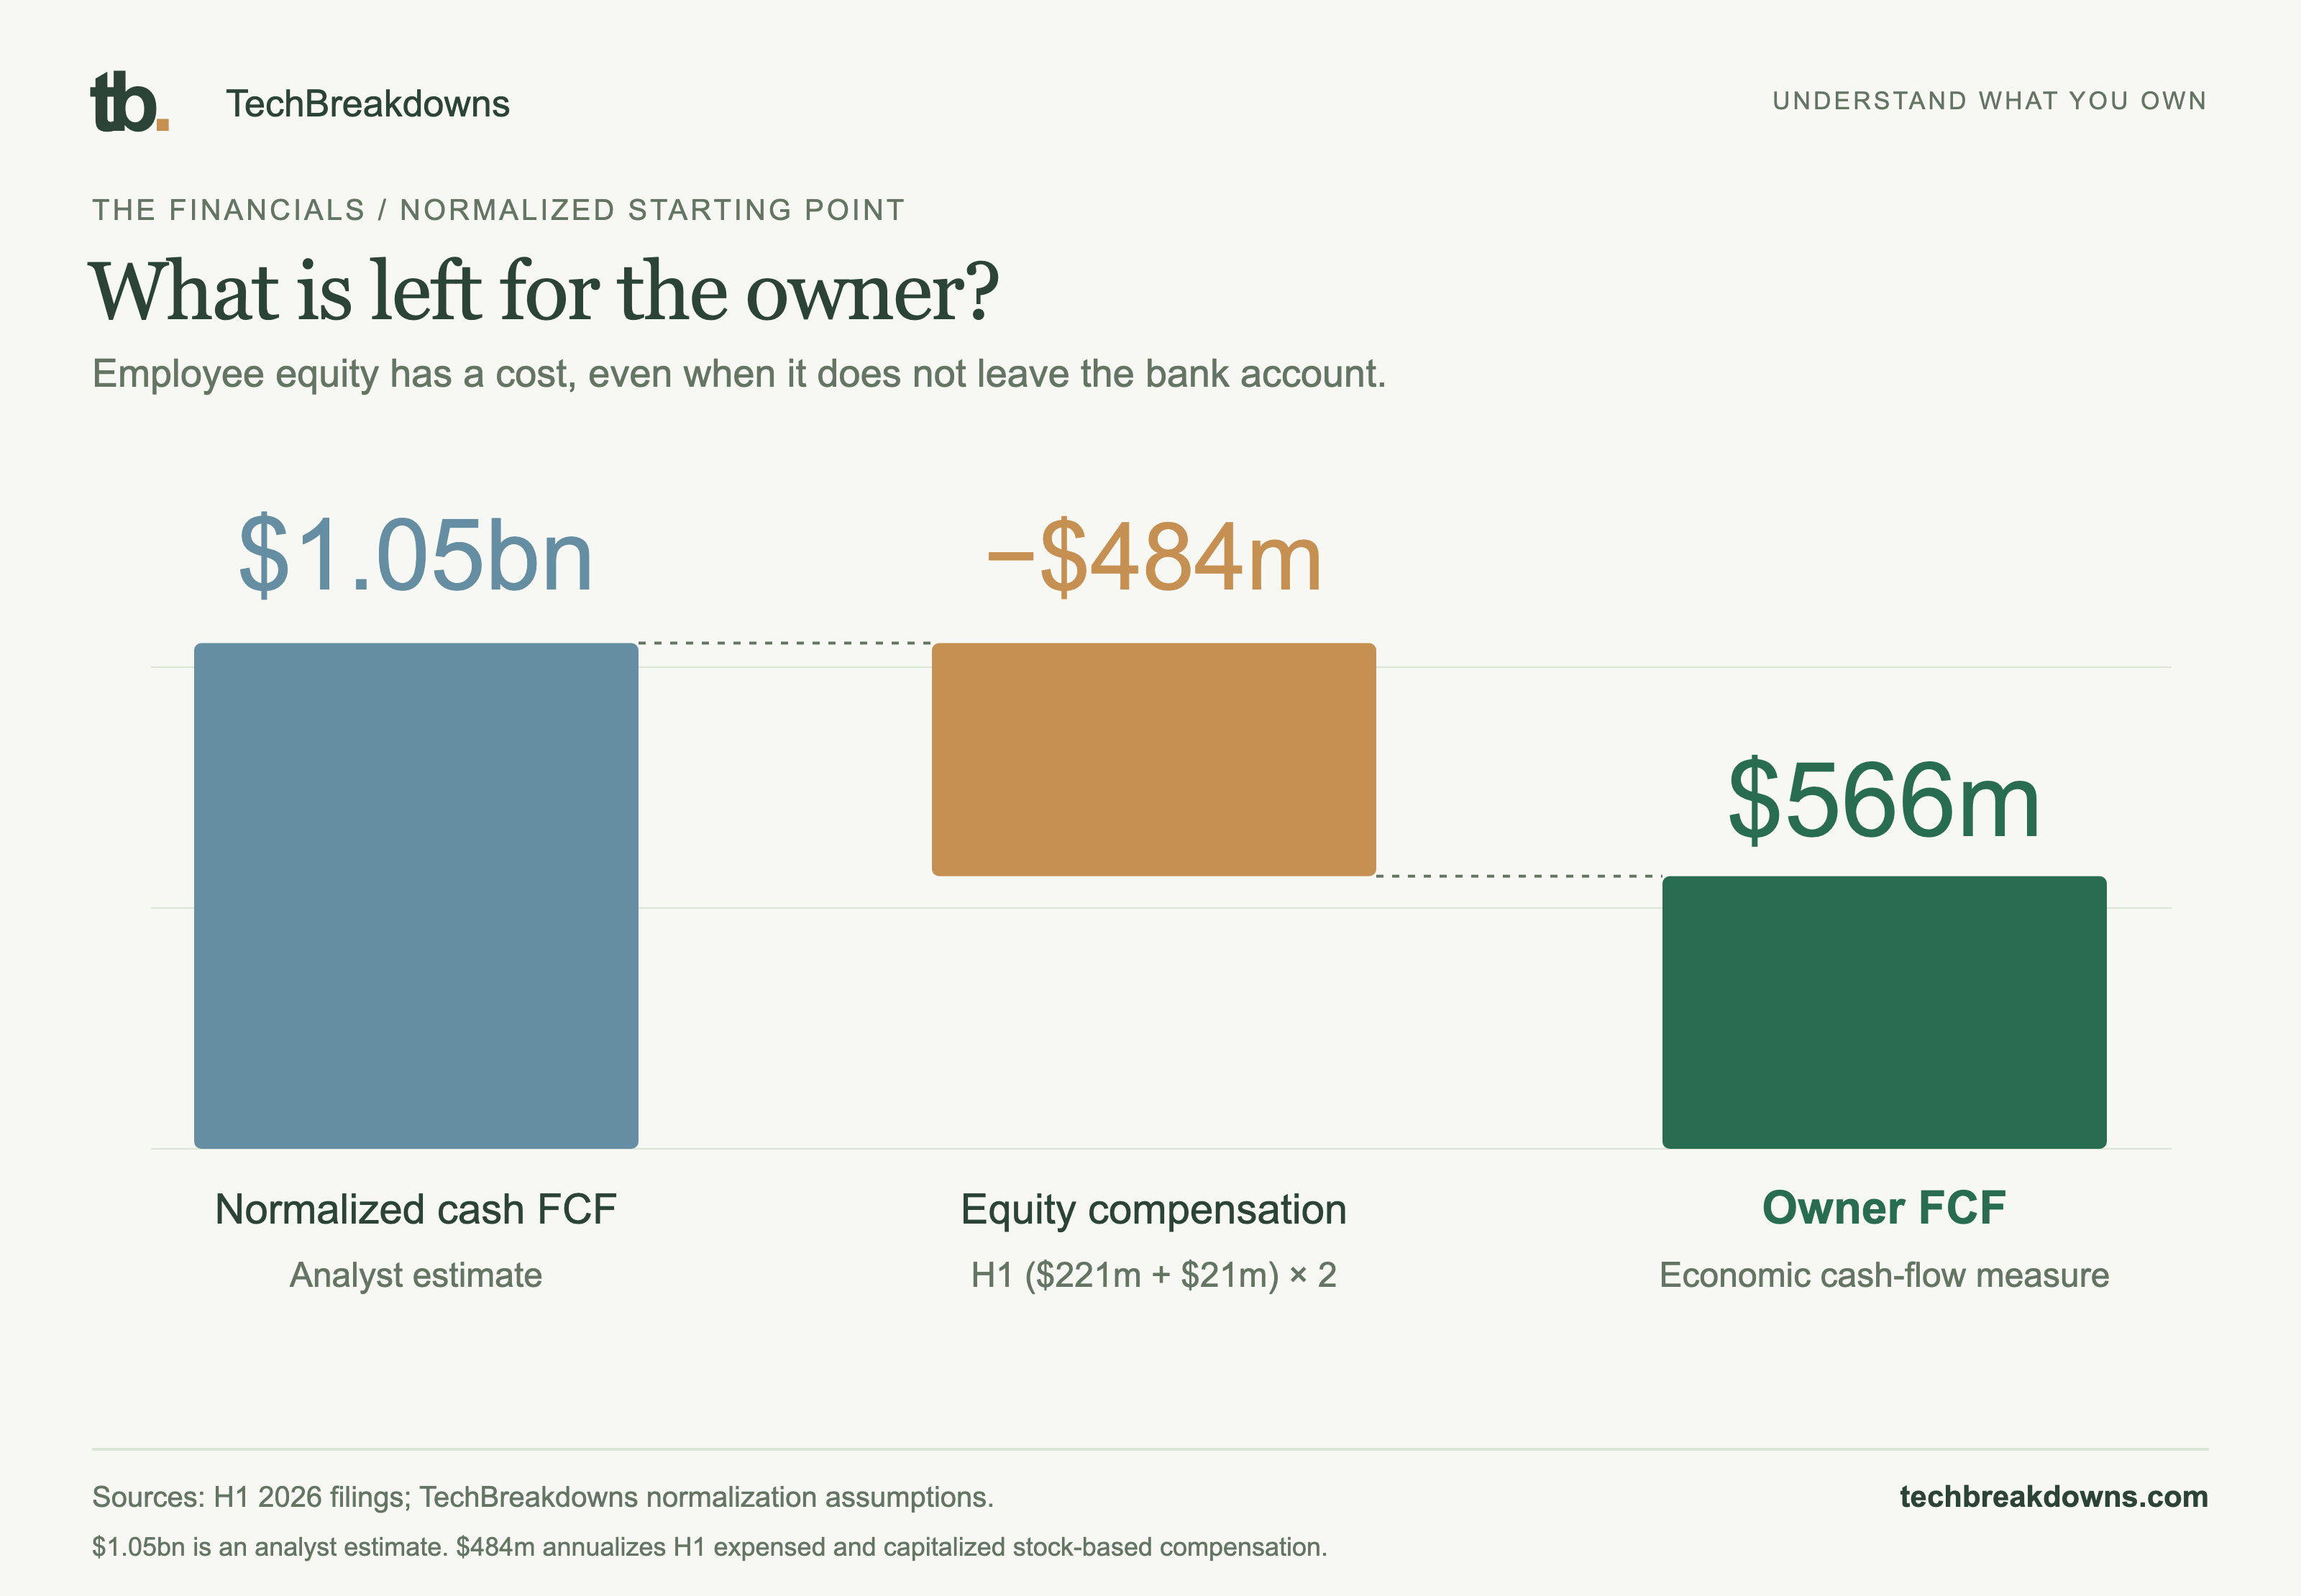
Our starting estimate is $1.05bn of normalized free cash flow. Reserving $484m for annualized equity compensation leaves $566m of owner cash flow. Growth matters, but so does what employees receive in shares.
$1.05bn is an analyst normalization, not company guidance. $484m annualizes H1 expensed and capitalized stock compensation. $566m is an estimate, not a floor.
H1 2026 filings; TechBreakdowns normalization assumptions.
Published model · September 20, 2026These are quarterly facts. The projections below are our assumptions, clearly separated from them.
completed orders
includes the broader basket
already net of shopper pay
reported combined category
Q2 2026 reported data anchors the model. The projected cases are analyst assumptions, not company guidance.
Two views of the same business. The first explains the reported relationship; the second responds to your assumptions.
Transaction revenue is reported net of shopper payments and incentives. Advertising and other revenue comes from brands and retail partners around that same shopping activity. These ratios describe a quarter in aggregate; they are not a literal receipt for one order.
Loading reported business flow…
The final forecast year is shown first so a slider changes the picture. Choose another year to inspect the path.
Pick a story, then change its assumptions. The model updates the operating path, cash flow, share count, and five-year value.
Start with the six big questions. The deeper controls below let you test basket size, individual cash margins and how future shares are created or retired. Your active case stays in this page's link.
| Year | Orders millions | GTV | Revenue | Cash FCF | Equity pay | Owner FCF | Shares millions | Cash ending |
|---|
These graphics show the published assumptions and the $48.73 reference price from September 11, 2026. They stay fixed when you change the live model.
 Enlarge graphic
THE ASSUMPTIONS
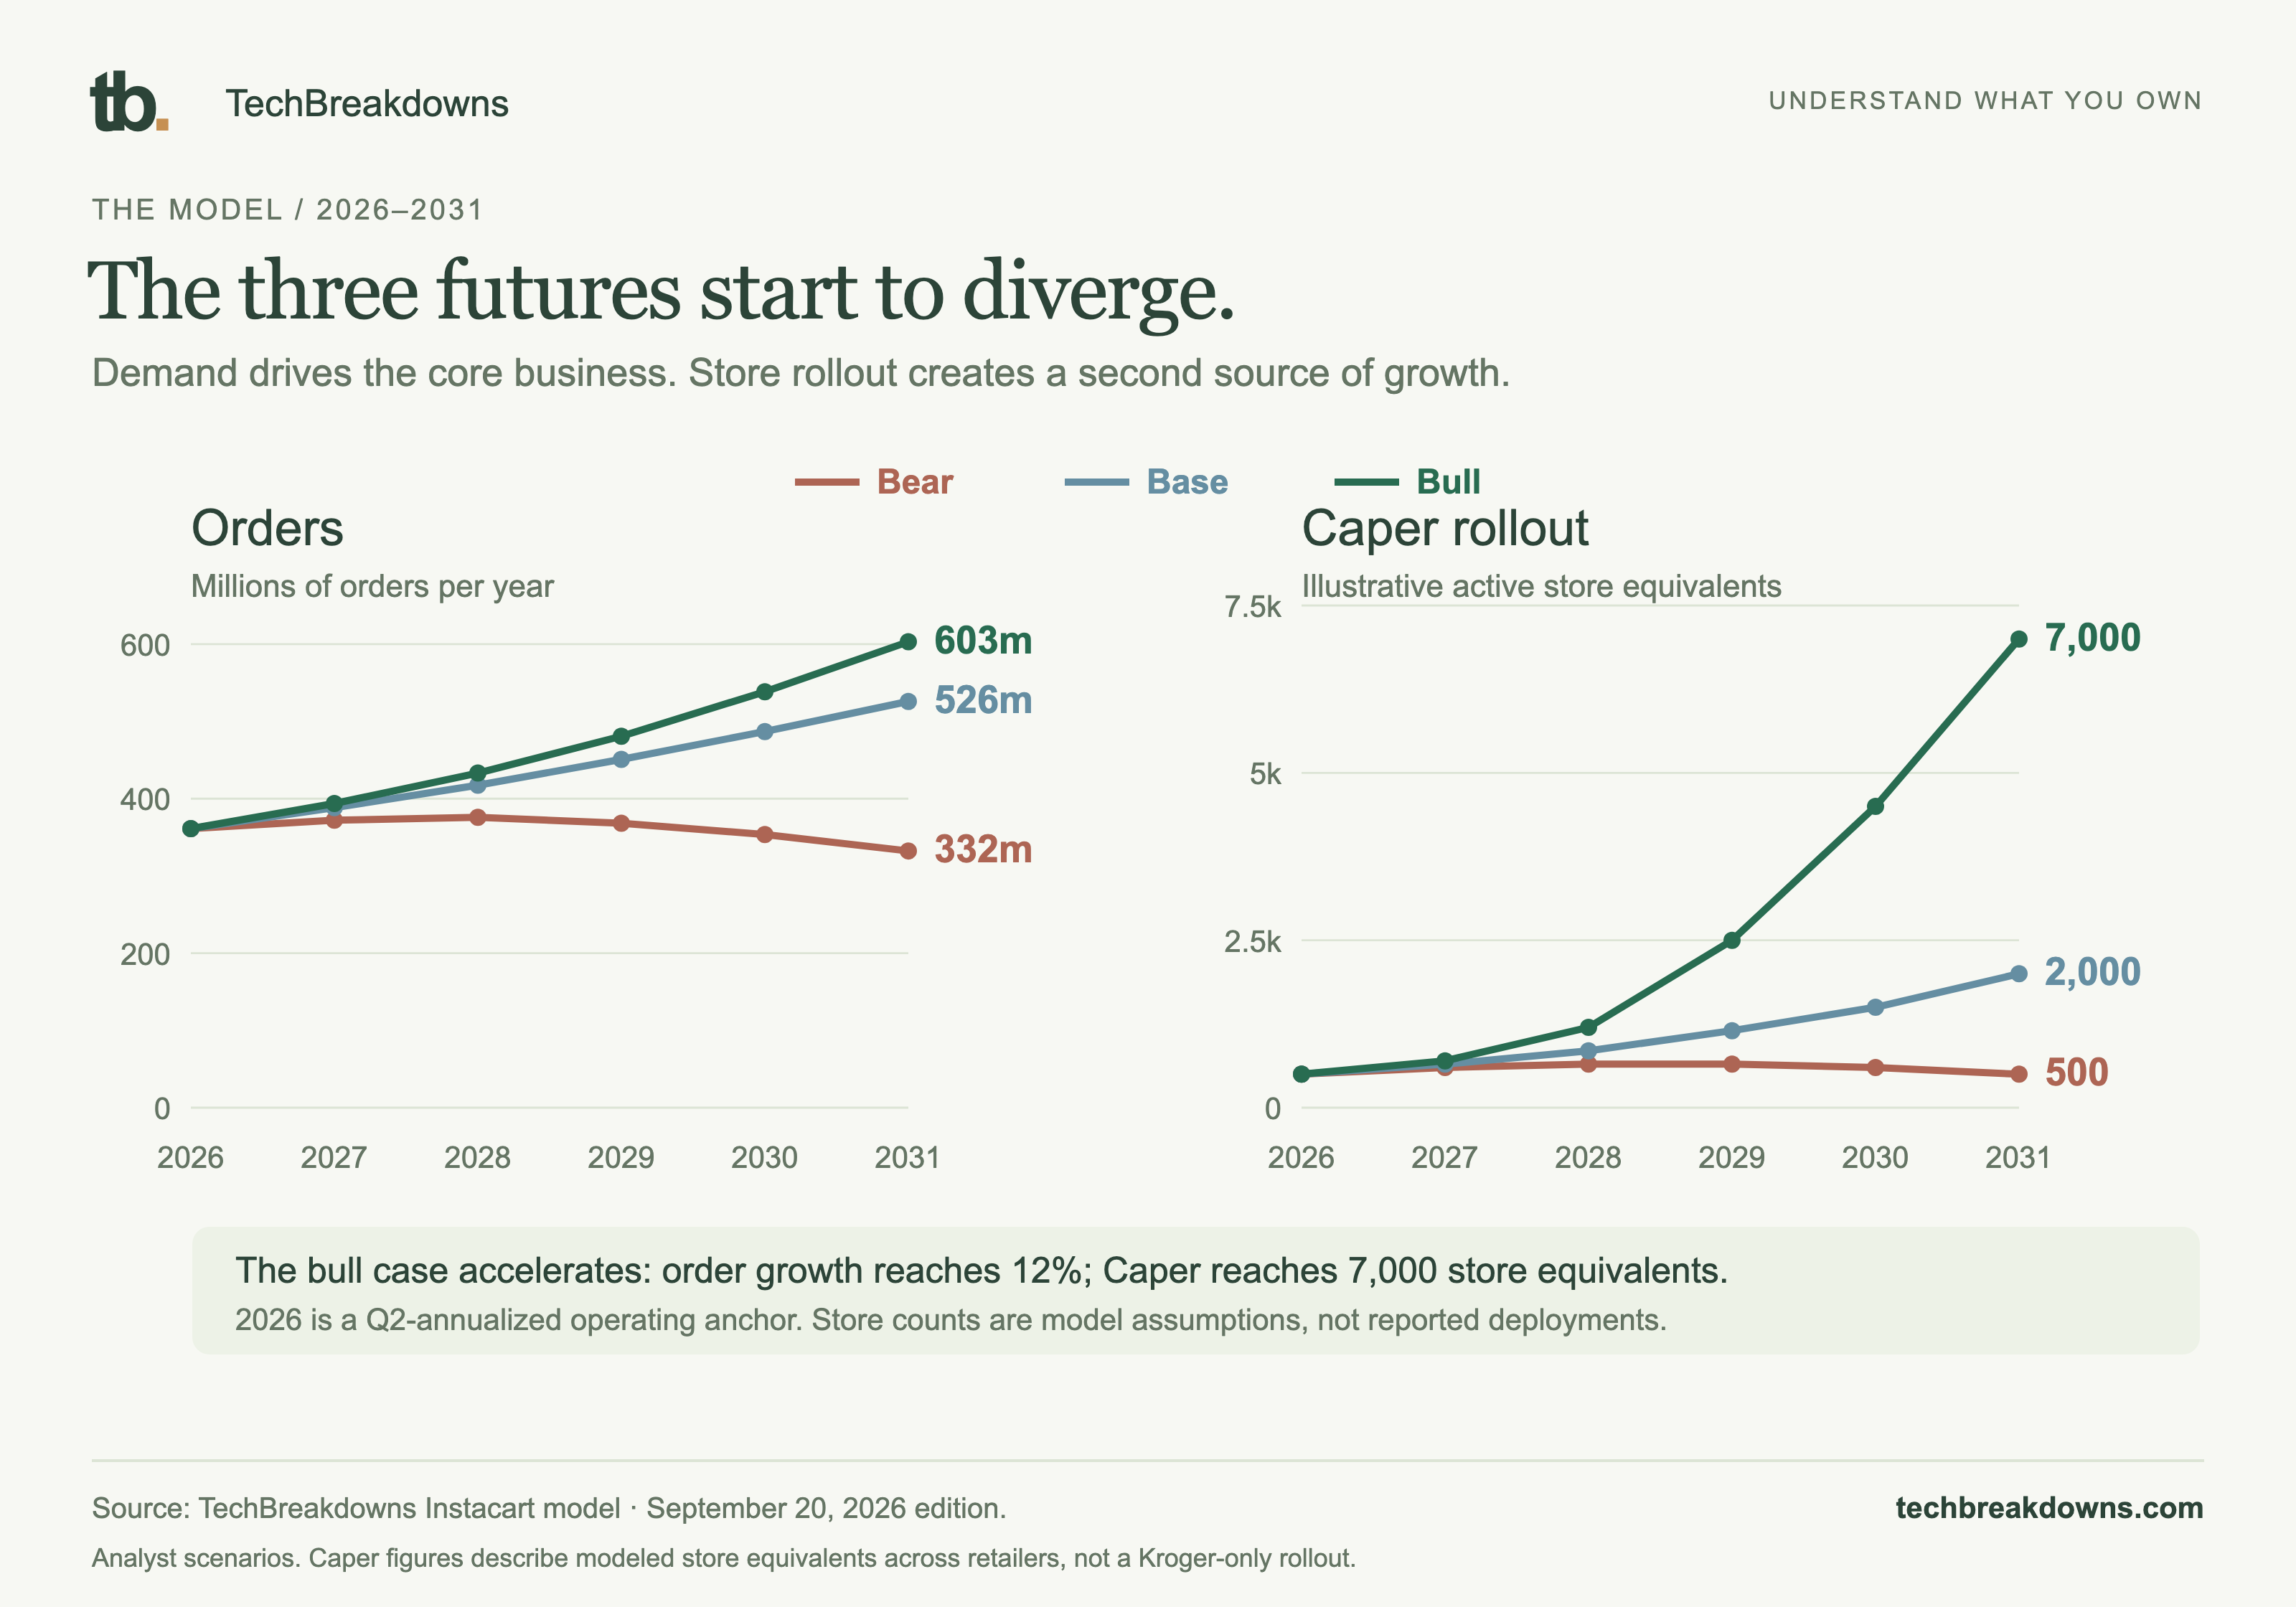
Order volume drives the existing business. Caper adds a separate rollout assumption. Compare the paths before deciding what an ending is worth.
 Enlarge graphic
THE BEAR CASE
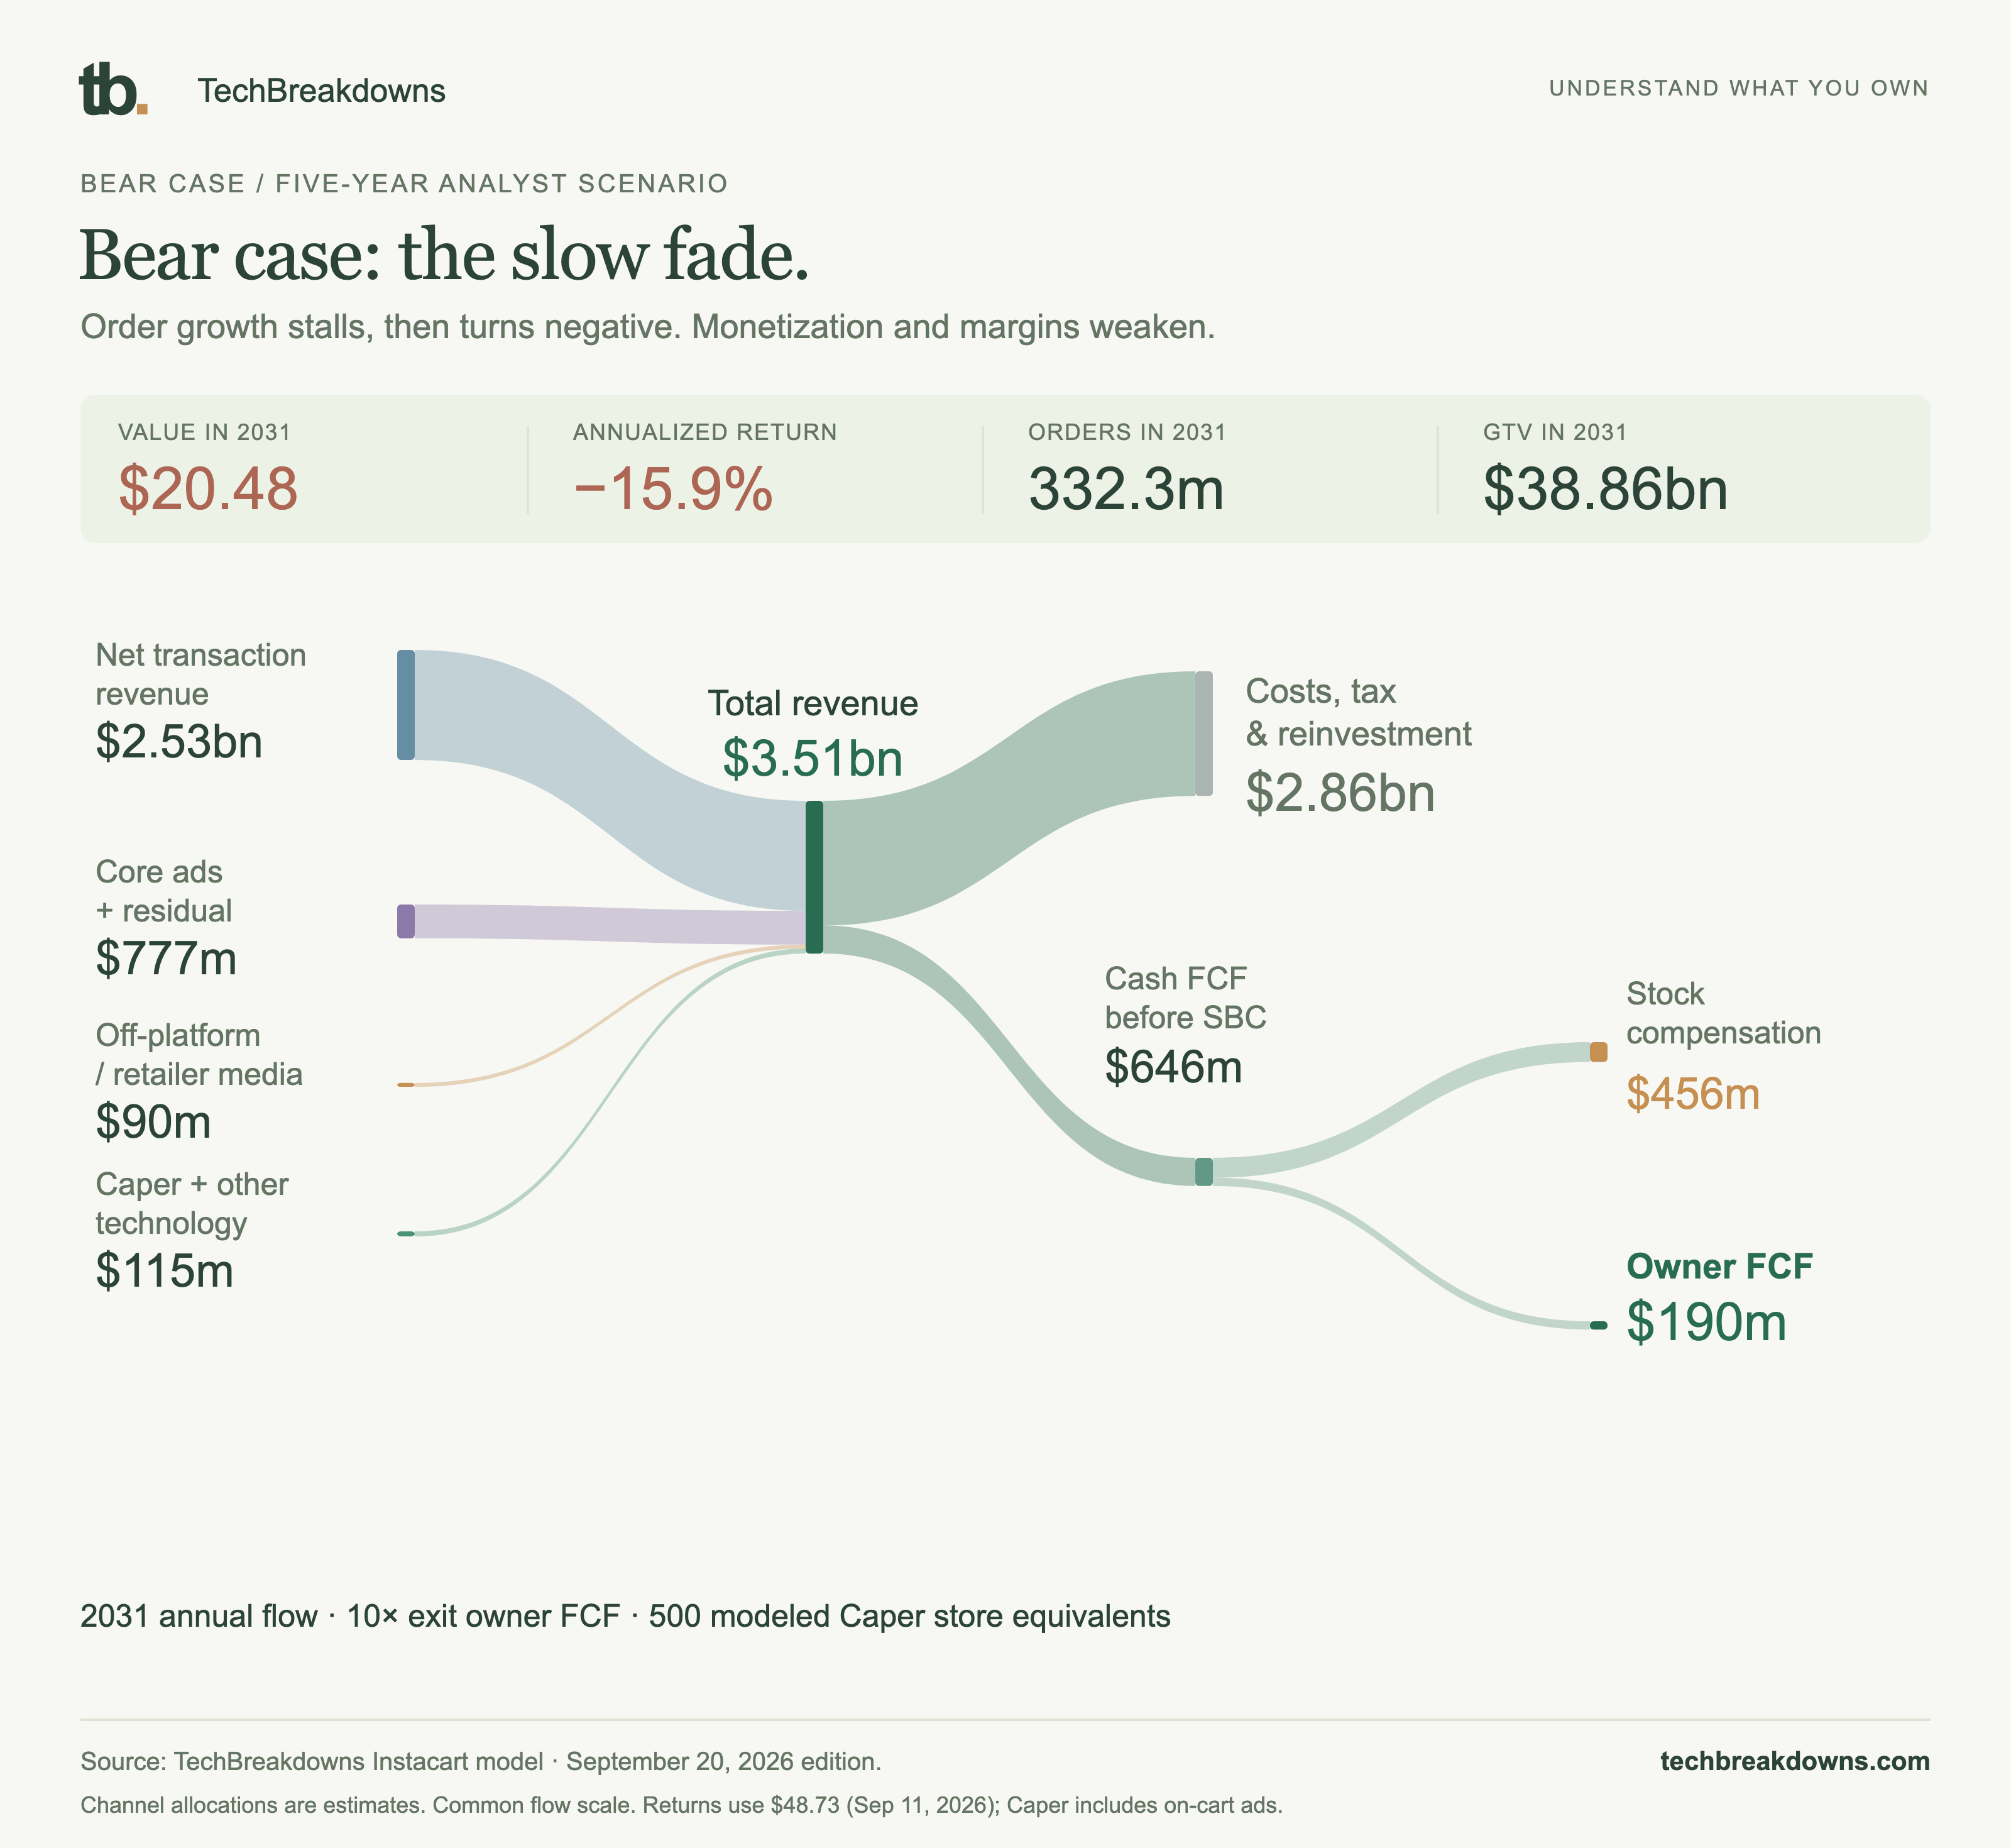
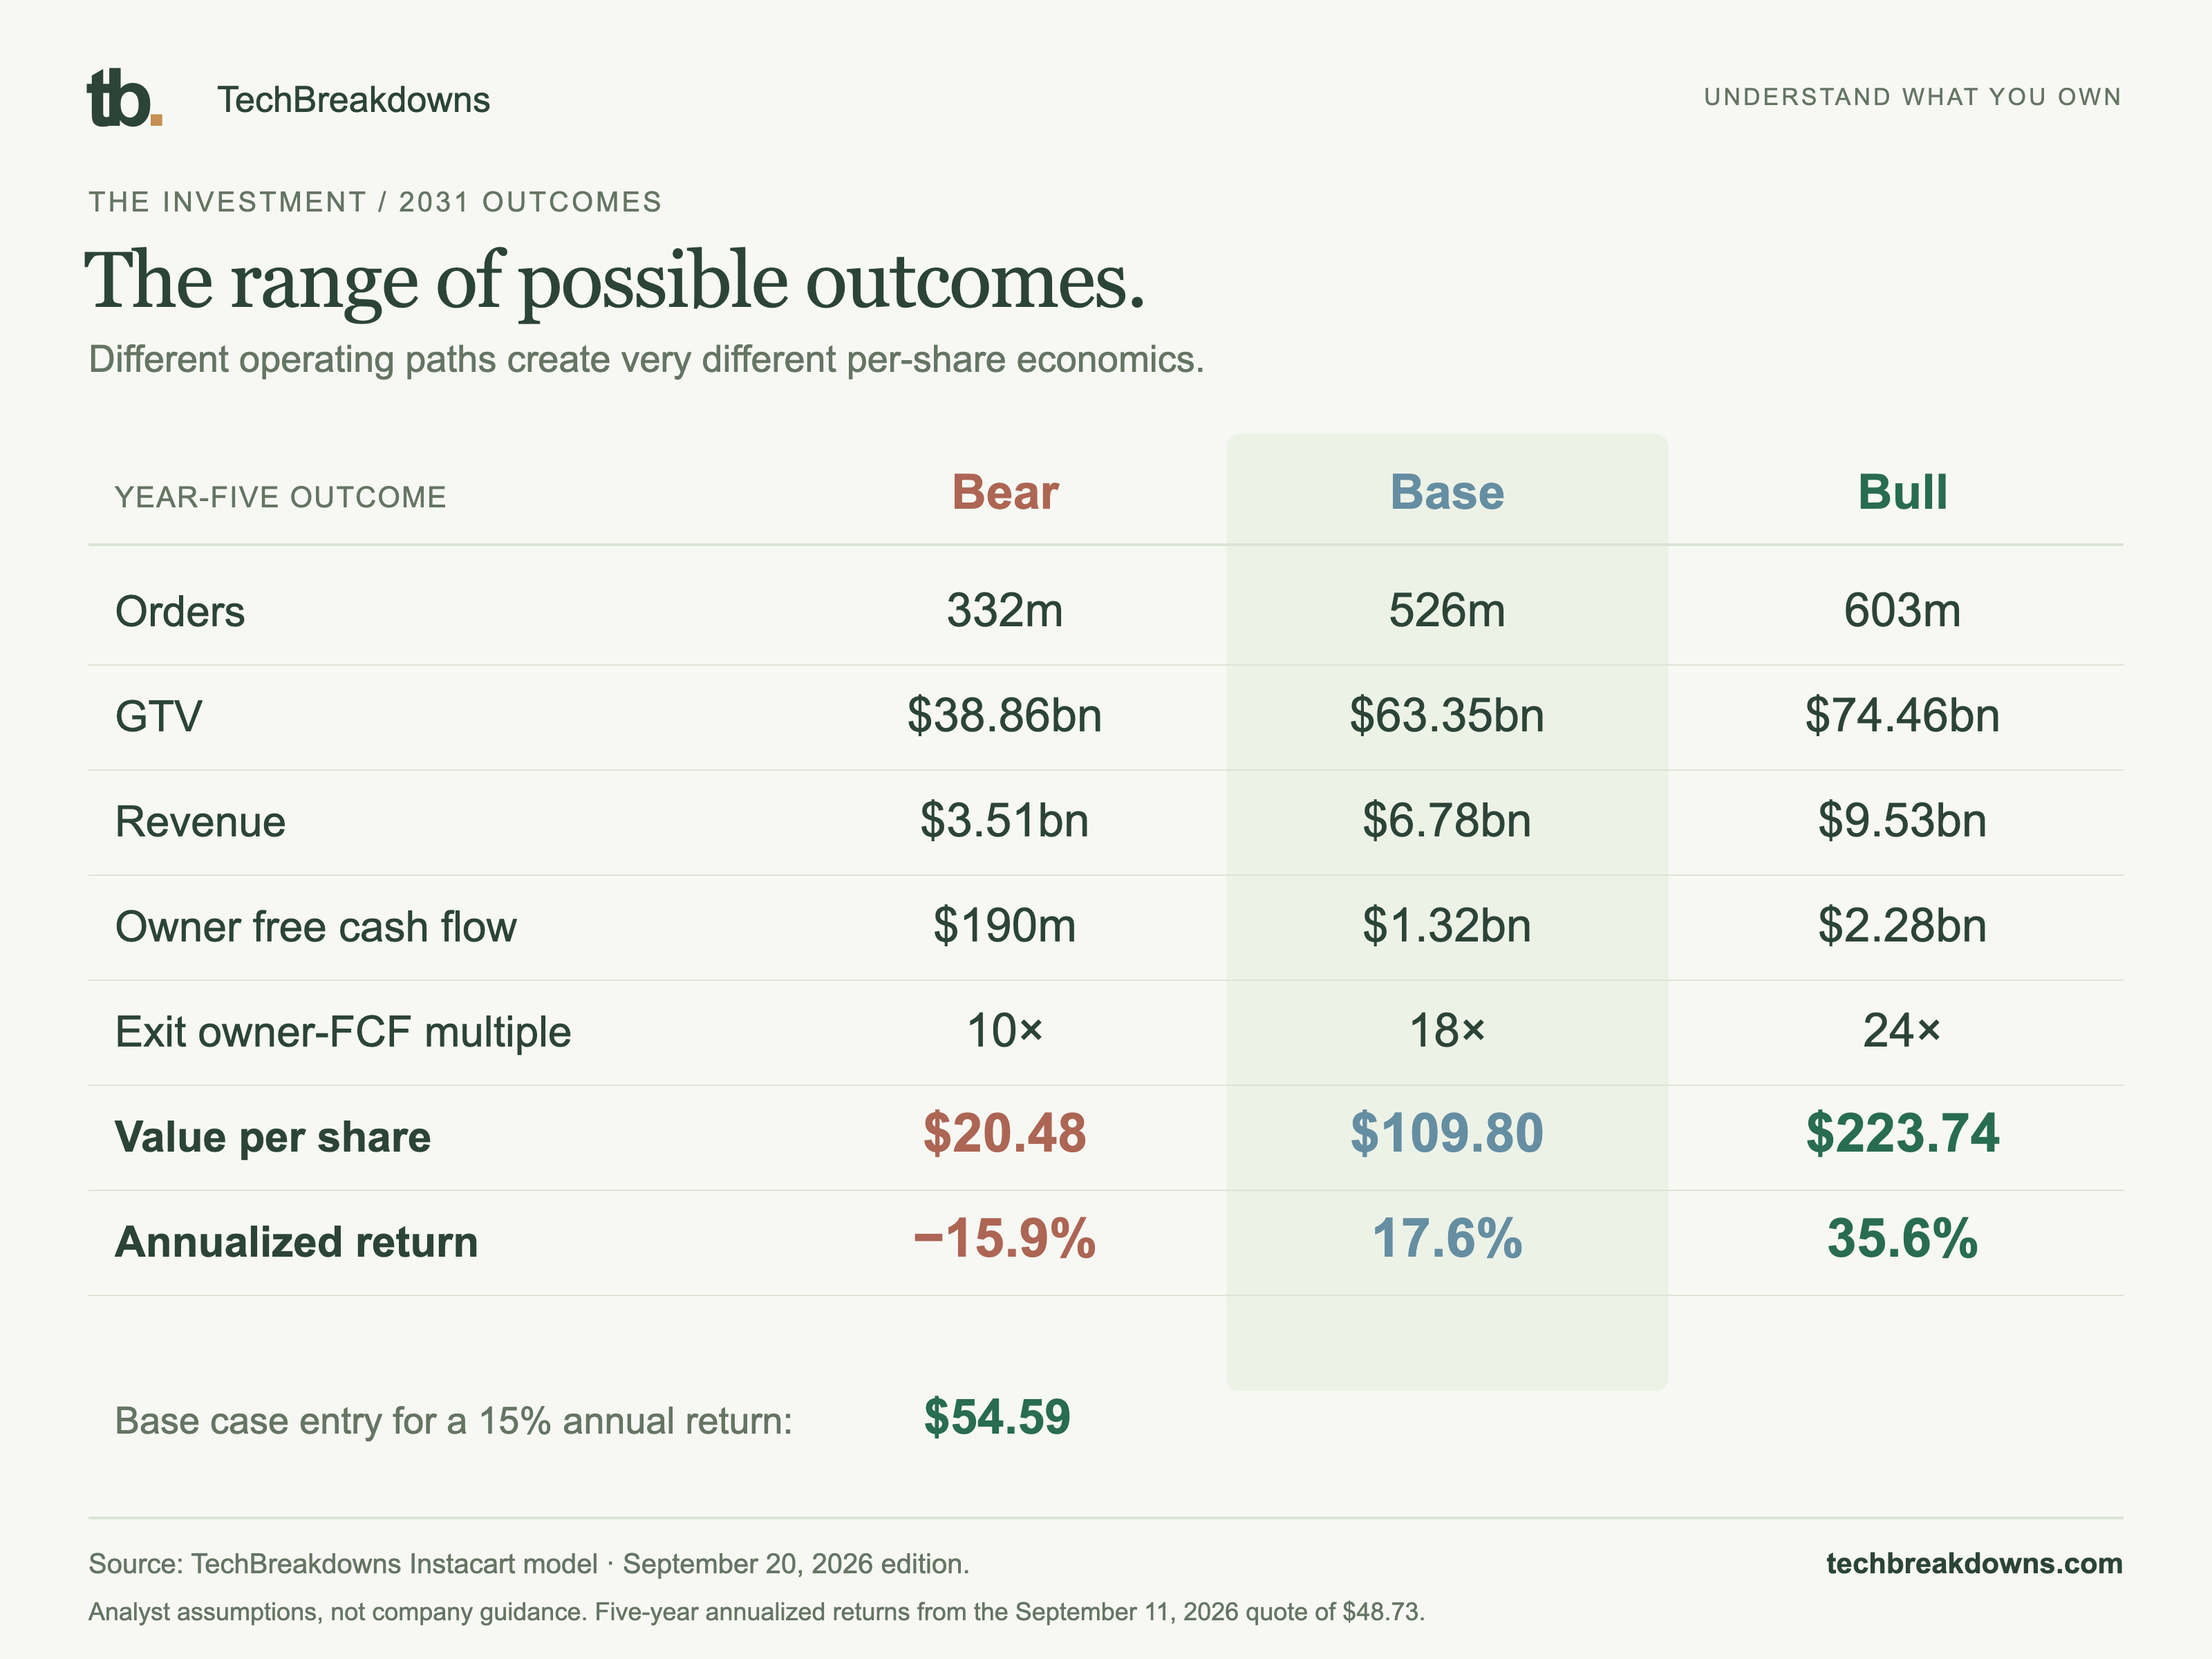
Orders stall, then fall. Monetization and margins weaken. The remaining owner cash flow supports a much smaller valuation.
 Enlarge graphic
THE BASE CASE
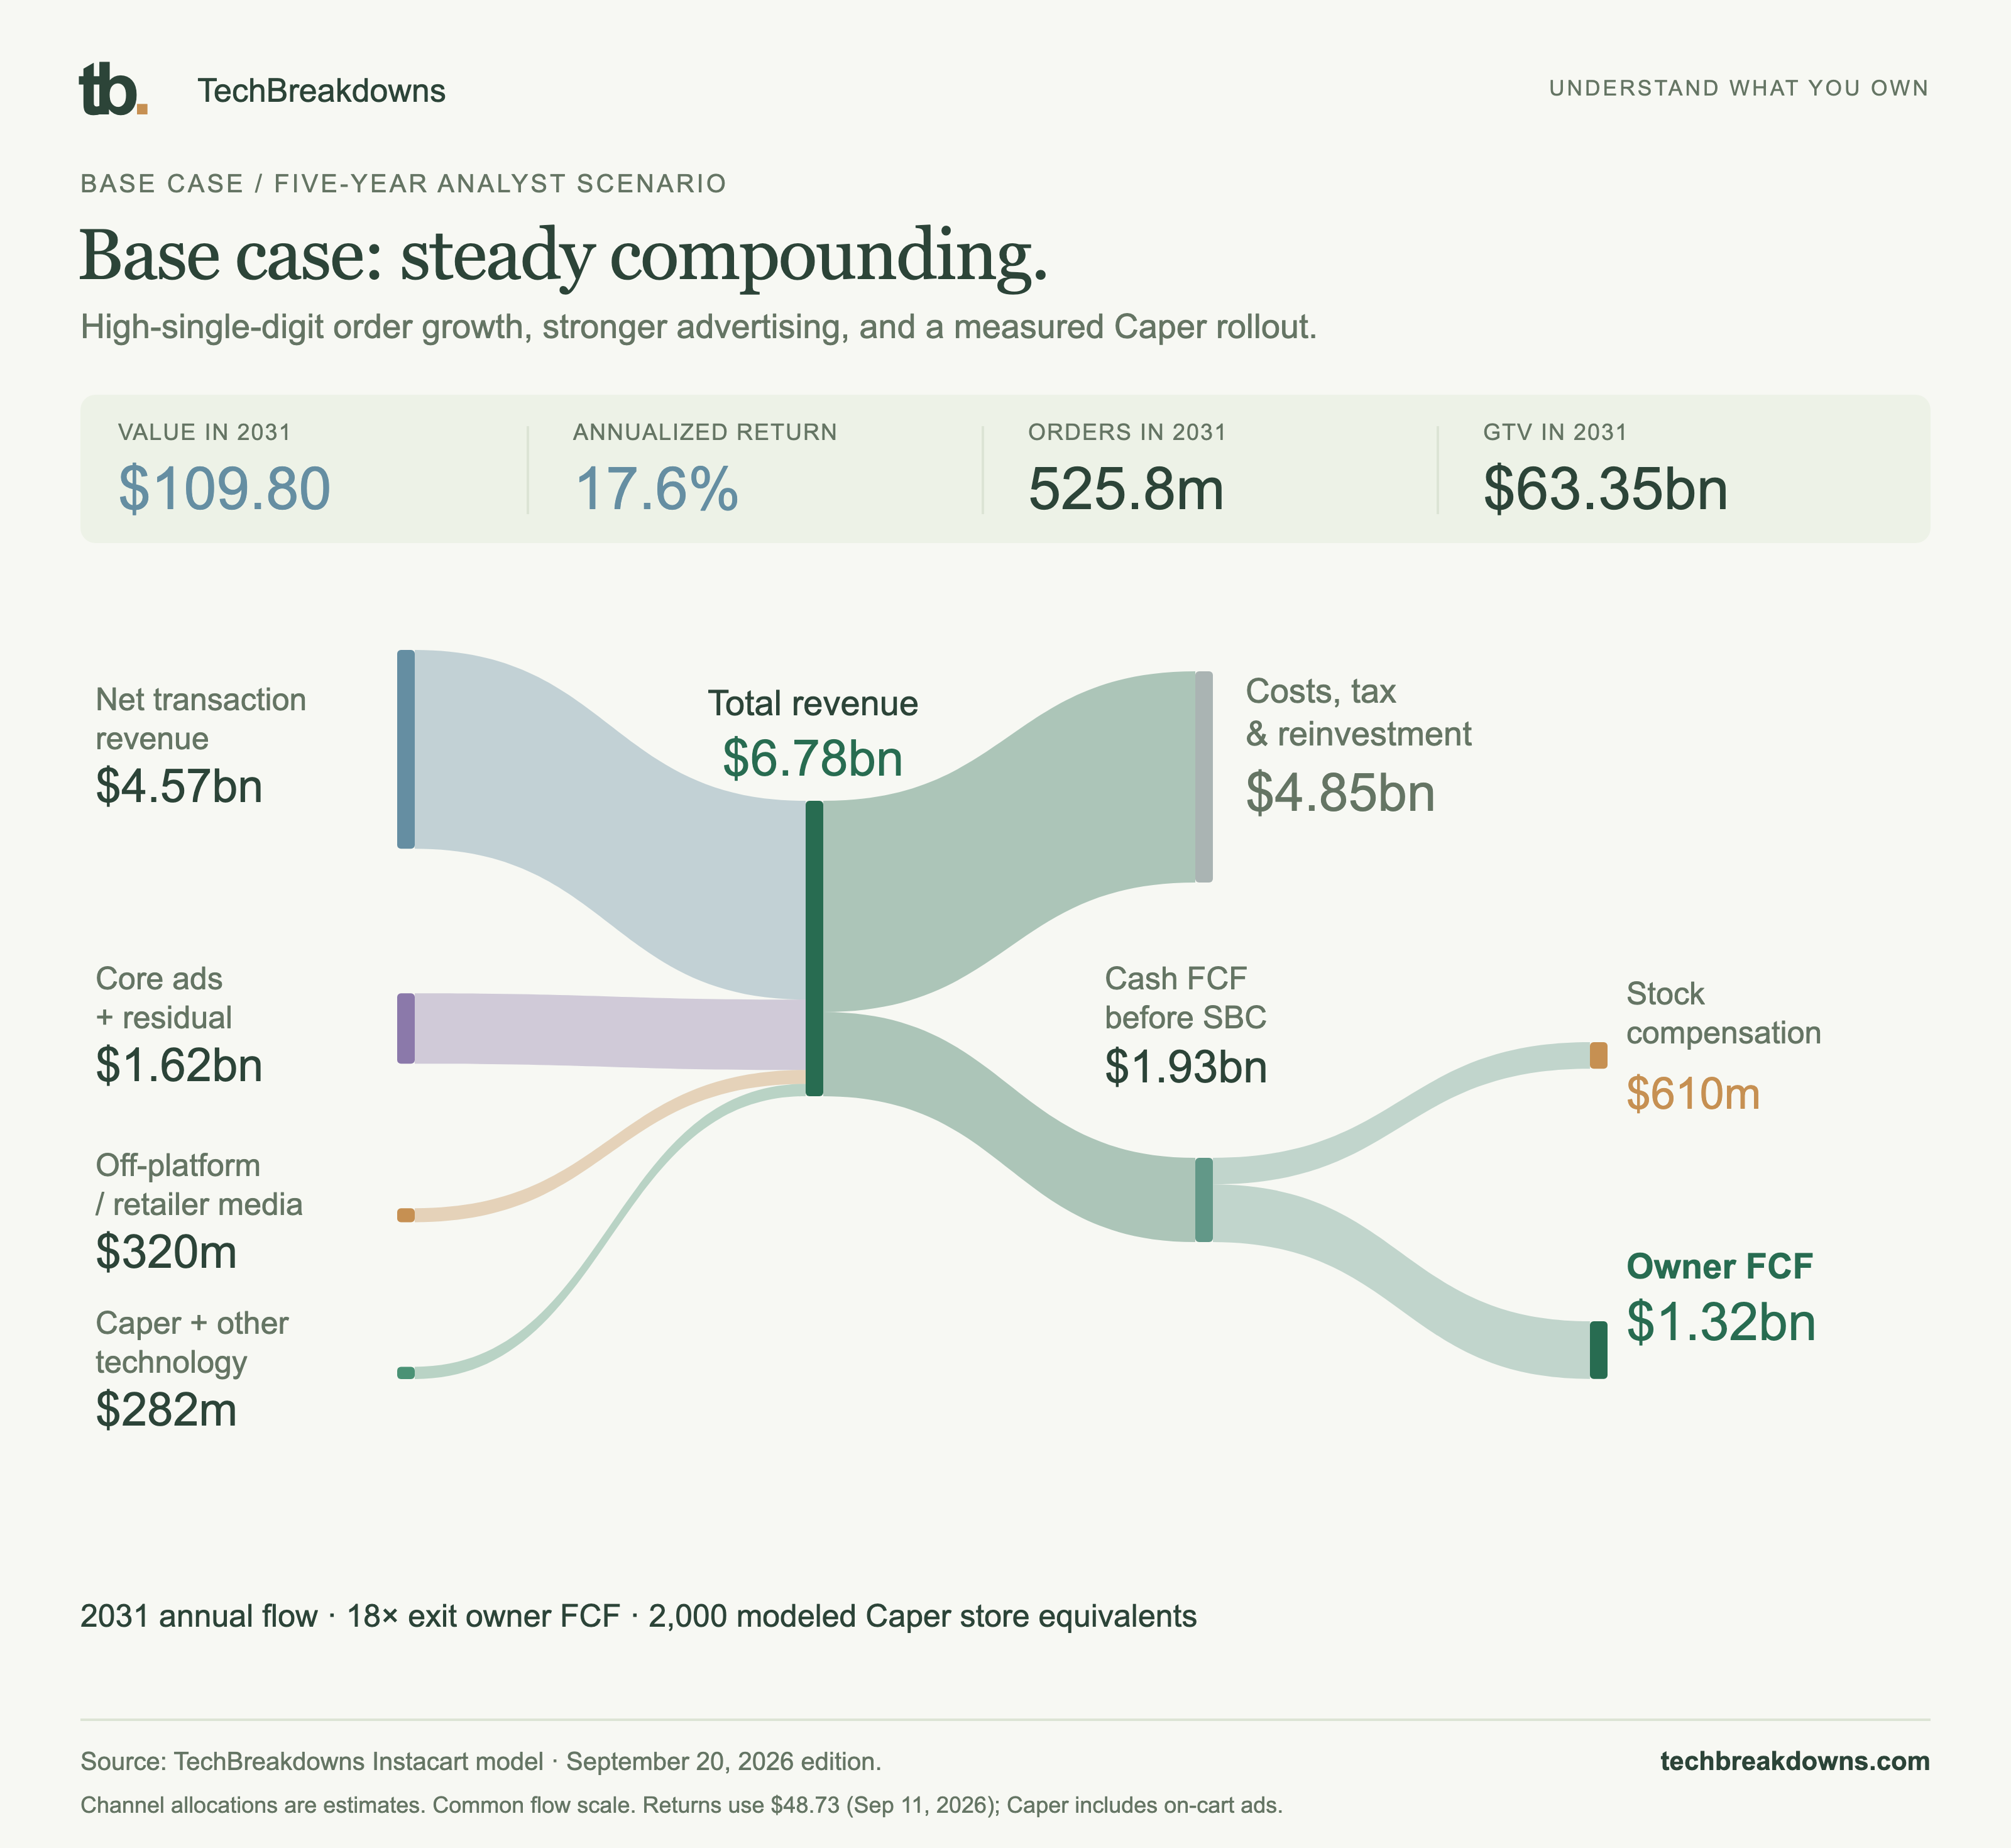
High-single-digit order growth, stronger advertising and a measured Caper rollout grow the cash engine. This case still needs the operating assumptions to hold.
 Enlarge graphic
THE BULL CASE
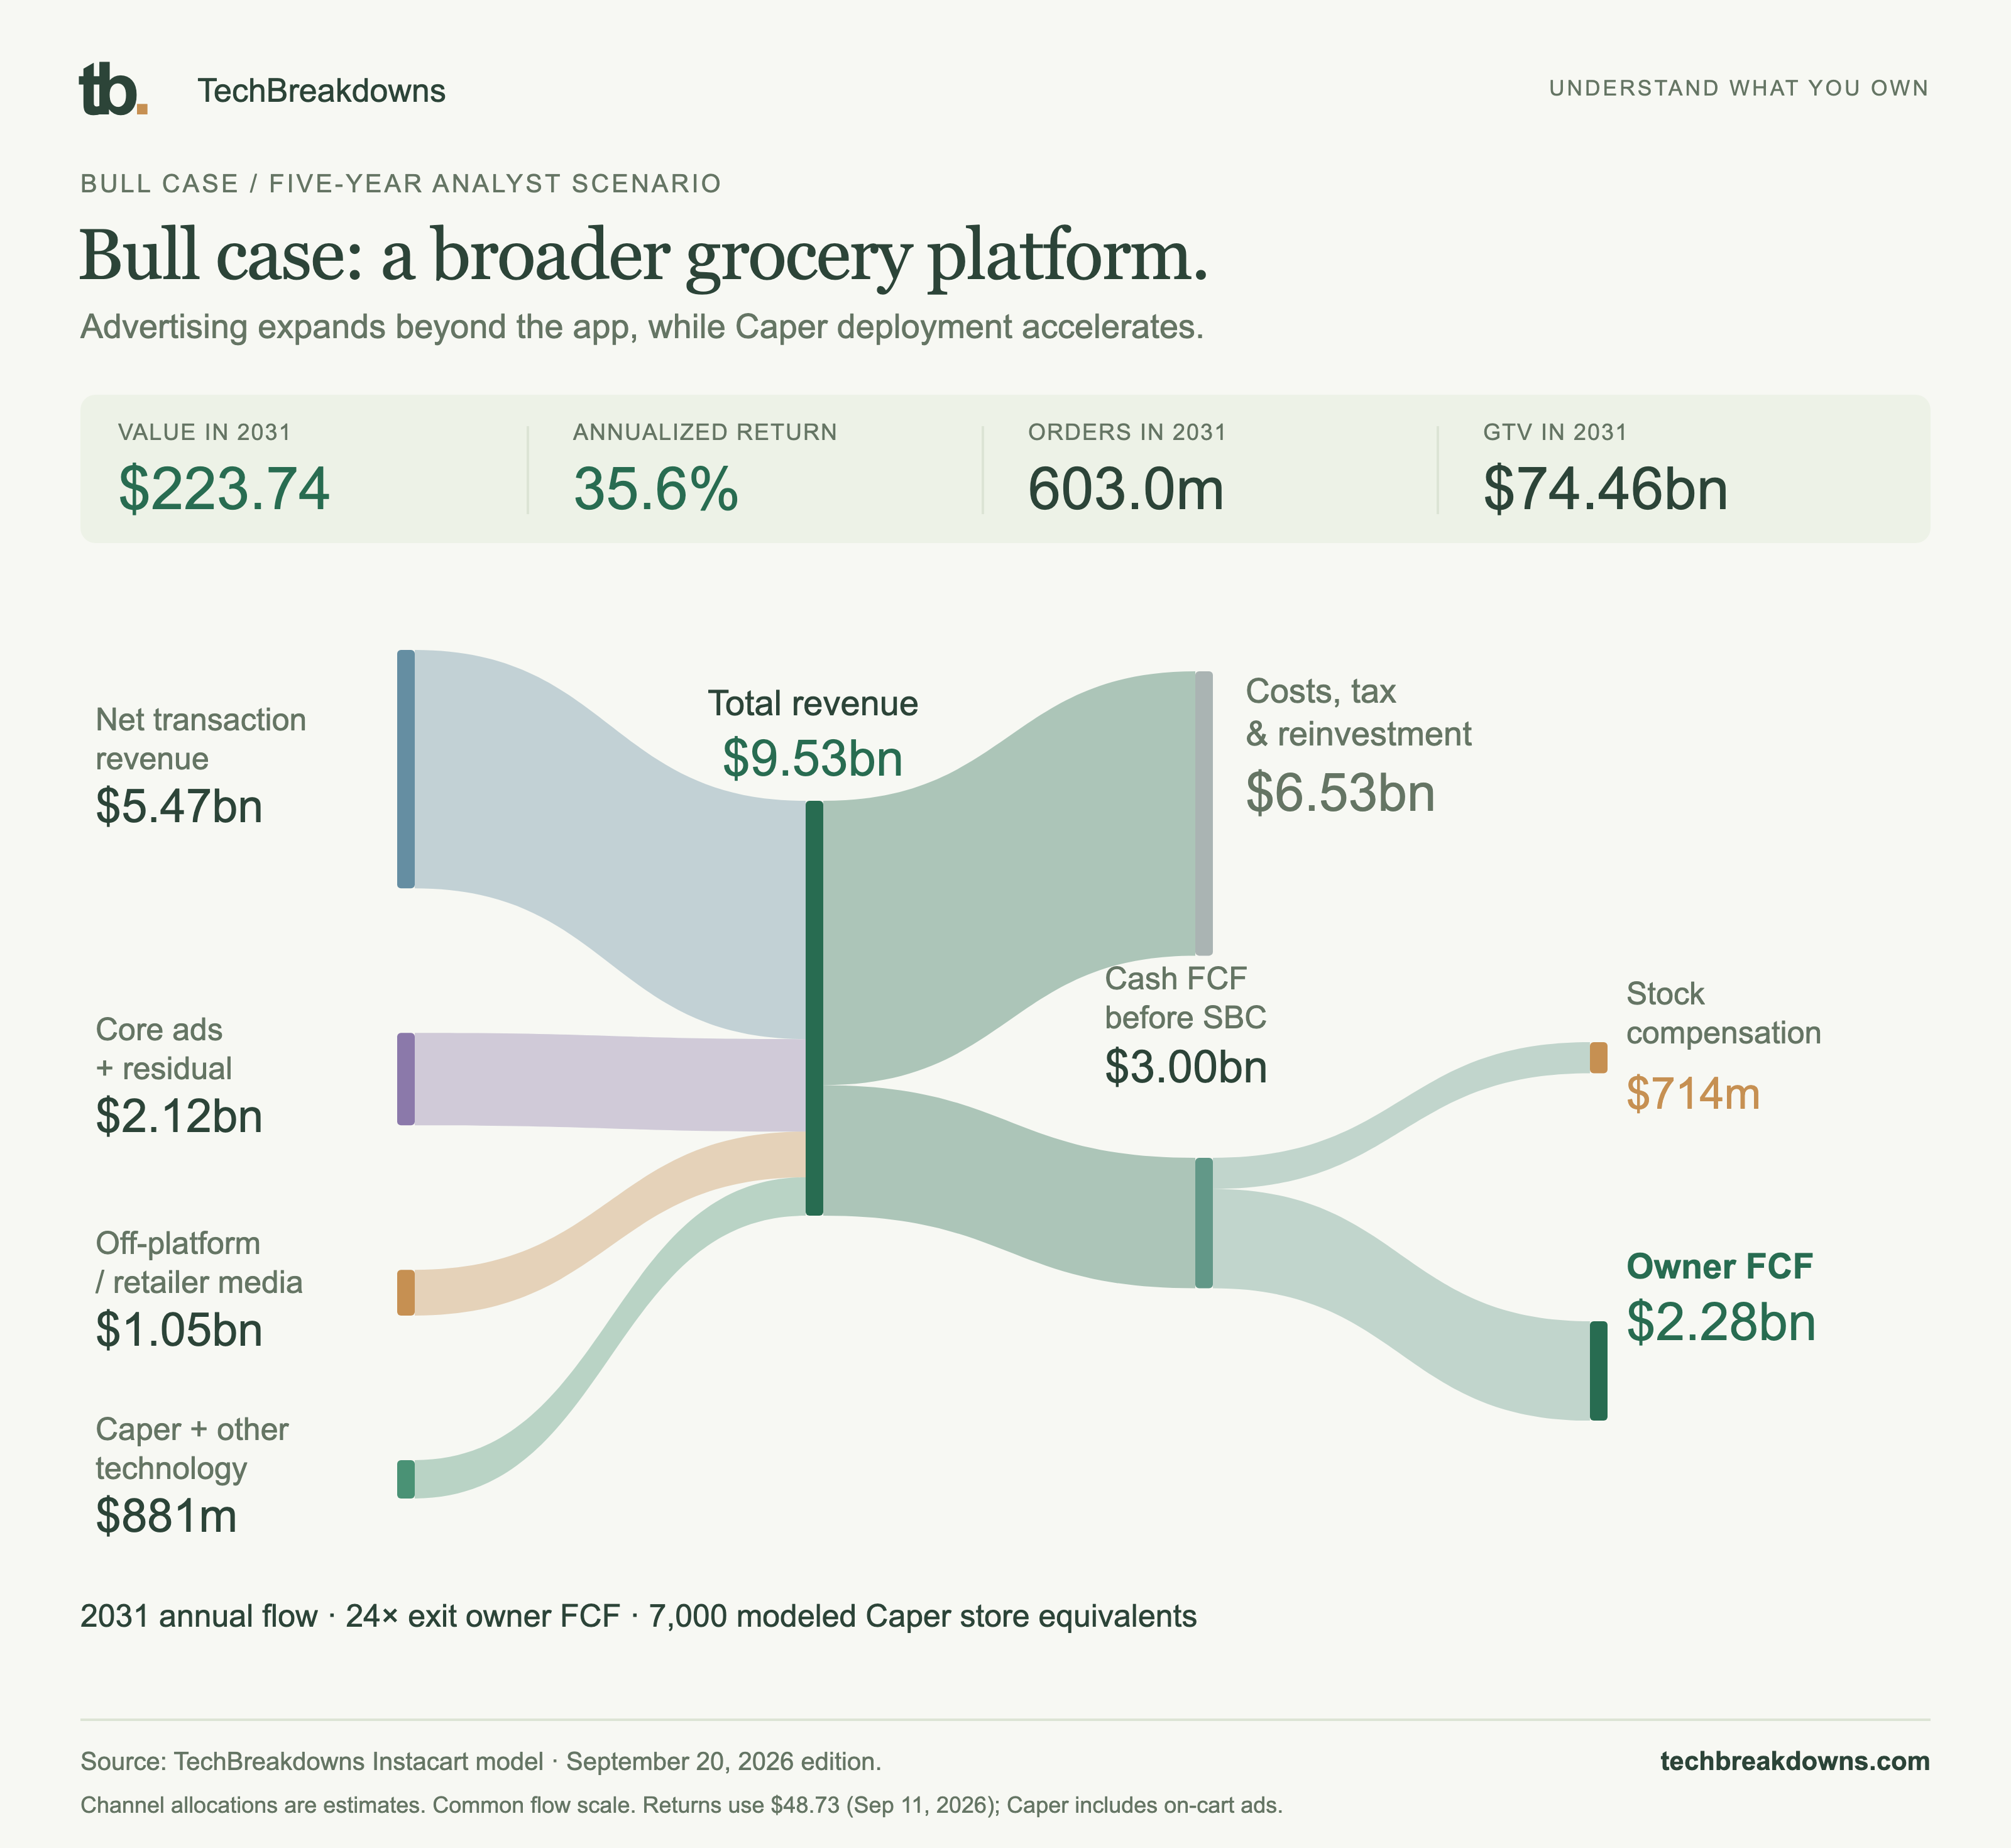
Stronger orders, broader advertising reach and faster Caper adoption produce the largest cash engine. The 24× exit multiple is another meaningful assumption.
 Enlarge graphic
THE RANGE
Orders, monetization, cash margins and the price paid for future earnings separate the cases. Use the live model to decide which assumptions you would change.
THE THESIS TEST
Separate order growth from basket inflation, then check whether net transaction revenue keeps pace with the activity.
Watch monetization alongside publisher payments and cash conversion. More advertising revenue does not establish a better margin.
Look for repeat deployments, retailer renewals and credible operating economics. Announced trials are not a nationwide rollout.
Follow owner free cash flow and diluted shares together. Gross buybacks only reduce the share count when they exceed employee share issuance.
IN THE TECHBREAKDOWNS SYSTEM
Follow Instacart into the market it serves, the indices that track its stage, and the model portfolios that hold it.
Grocery marketplace and retailer technology
Also at this stage MercadoLibre, Amazon, Walmart, Target, Costco, eBay and 7 more.
Grocery picking and delivery coordination
Also at this stage UPS, FedEx, DHL Group, Amazon, Uber, DoorDash and 3 more.
Instacart is 0.07% of the cap-weight index and 1.37% of the equal-weight index, as of Oct 6, 2026.
Held since Aug 12, 2026: −9.7% from its logged entry price through Oct 1, 2026. It passes the current screen.
This is a five-year future-value exercise. The price multiple applies to year-five owner free cash flow; accumulated cash and future shares also matter. It is a way to test a thesis, not a forecast supplied by Instacart.
Core ads, off-platform media and Caper/technology are analyst allocations within reported “advertising and other.” Their margins, store counts, revenue per store, normalized cash conversion and future valuation multiple are assumptions. They are not disclosed segments or signed deployment commitments. Storefront Pro, FoodStorm, Carrot Ads and AI/insights are mapped into broader fee or enterprise estimates rather than forecast separately. Modeled Caper revenue includes on-cart advertising, so it is not added again to the ad bucket.
Forecast equity compensation issues shares at the editable execution price. Gross buybacks spend cash, retire shares and stop when the dated authorization is used. A repurchase does not erase the economic cost of equity pay. The model reserves operating cash and treats the preferred claim once, through the less favorable common-share outcome.
A reviewed filing updates reported orders, GTV, revenue categories, cash, shares and compensation. Analyst allocations and scenario assumptions are then reconciled to those facts and published as a new dated JSON edition. Old editions remain available for comparison.